Daily news, dev blogs, and stories from Game Developer straight to your inbox
Sponsored By
Featured Blog | This community-written post highlights the best of what the game industry has to offer. Read more like it on the Game Developer Blogs or learn how to Submit Your Own Blog Post
Game Telemetry with DNA Tracking on Assassin's Creed
A series of three articles reprinted from the now defunct Ubi Engine Room Blog, covering some examples of how telemetry is used at Ubisoft as part of their user research efforts.
13 Min Read

This is a reprint of a series of articles I wrote for the now defunct Ubi Engine Room Blog in early 2012, in collaboration with members of our tracking team, notably Sebastien Hinse, which covers some examples of how telemetry is used at Ubisoft as part of our user research efforts.
Note that these are no longer particularly current examples of our tools and practices, but might still be interesting for someone looking to learn about telemetry. Enjoy!
Game Telemetry with Playtest DNA on Assassin’s Creed - Part 1

Image created using 138 tracked players over 10 days after the release, for a total of 8,765,149 points or about 1200 hours of gameplay.
If you play videogames while connected to an online service, there’s a good chance someone is paying attention.
At Ubisoft, we have a set of tools called DNA which use tracking data from multiple sources in order to allow us to examine telemetric data of how players are experiencing our games. We are able to track players in both production, and in post-launch. Production tracking is used to give insight on the game in progress of being made and allow designers to adjust the gameplay between playtests. Post-launch data is used for a wide variety of things: improving the game with a patch, helping to orient expansions and downloadable content for the game, and to advise the creators of the next game in the brand, or even other brands.
The technology allows us to gather and examine the players’ actions via data that is collected while they play. This data can either be viewed on a map overlay, or in a table, depending on the type of information. See below for two examples of playtest data, while the above image represents real players in post-launch:
Pointmap:

This image is a heatmap of all of the failures of the playtest participants in Assassin’s Creed Brotherhood, in the fifth mission of Sequence 5. The mission was subsequently made a little easier. (Legend: Points go from green to red based on density.)
Kills Table:

This table shows the number of kills done by the playtest participants in sequence 4. It allowed us to confirm the design intention that players should use the counterattack less often, in favour of the new combo system.
In playtest, we use the above information to gain previously impossible insight into the way our players are experiencing the game. The information presented is extracted and analyzed by members of the Playtest Lab team, and delivered in a report to the game developers.
In post-launch, we are generally more interested in aggregated information that groups together the millions of players in a simple easy-to-understand visualization. For this we use a tool we call DNA-Live, which allows stakeholders real-time access to a wide variety of metrics updated daily and representing every single player connected to an online service. For example here is a chart showing economic data for Assassin’s Creed Brotherhood.
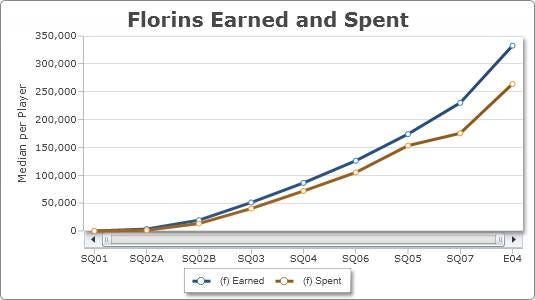
This shows that the economic system in Assassins Creed Brotherhood was quite well balanced.
Game telemetry is providing playtest analysts and game designers with an incredible new source of information we can use to improve our games. We are all very excited by the possibilities tracking has to offer us.
In future blog posts I will further discuss the technology that allows us to collect and display the information, give some more examples of its use on AC games as well as some others, and look a little into the future to see what new developments will allow us to further improve our video game telemetry tools.
Game Telemetry with Playtest DNA on Assassin’s Creed - Part 2
This section covered a single case from beginning to end, while introducing some new concepts along the way.

First, a quick note on anonymity: all of Ubisoft’s tracking data is devoid of any kind of personally identifiable information. In accordance with our EULA, we only collect information that will help us to improve current and future titles.
The mystery of the Reinit
One of the great advantages of working on a brand such as Assassin’s Creed is the potential for learning. We are able to continuously improve by using playtest data to inform our post-launch tracking, which in turn gives us data to analyse and provide feedback to the developers of the next opus.
Assassin’s Creed Brotherhood
Assassin’s Creed Brotherhood included a new Constraint system, which allows the player to complete the missions with an extra restriction in order to receive “full sync”. This new gameplay system is not simple to implement, and it was difficult to accurately gauge how much players would actually use it in post-launch.
Additionally, the Constraint system was developed and implemented rather late in the development cycle, and thus slipped under the radar of the tracking system design. No post-launch data would be collected directly on the Sync status per mission of the players.
Once the game was released, we quickly made a Mission Report to ascertain if players were getting stuck or quitting on any missions. For this we used our “objective_stop” tag. This tag is sent at the end of every mission, with attributes that describe the conditions in which the mission ended. These are usually either: Death, Failure, Success or Reinitialize. These are mostly self-evident, with the exception of Reinits which are when a player manually quits the mission via the menu.

Missions with an average of more than one reinitialization per player on average are considered higher than expected.
We noticed an unusually high number of Reinits on a few missions that we had difficulty accounting for. Why would players repeatedly manually exit the same missions?
We hypothesized that it was related to the more difficult constraints, and that some players were retrying the levels, and quitting if they failed the constraint in order to restart the mission and try again. While it seemed to match up nicely with the more difficult constraints from the playtest, without any direct tracking of the system, it would remain an educated guess.
We were however able use another source of data to try and answer the question in a different way: Game2Web data. This information is used for the Assassin`s Network website, and is updated each time the player saves their game which allows us to have a snapshot of their sync levels at that point in time.

Global sync is achieved by completing the optional objectives of the constraint system.
We can see by the peak that most players finish the game with just over 50% sync, but that many players finish with higher, confirming that they are indeed using the constraint system.
Assassin’s Creed Revelations
Once the developers confirmed the return of the constraint system for Assassin’s Creed Revelations, we made sure that this time it would be tracked, both their completion during pre-launch playtests, as well as in post-launch by players at home.
In order to track the constraint system, we needed to add a new attribute to the “objective_stop” tag. This attribute would let us know whether or not the constraint objective was successfully met by the player upon completing the mission. Below is an example of a tag as sent by ACR in post-launch.

This player quit the mission in progress after 170 seconds with an incomplete constraint.
Once the game came out, we were able to repeat the exercise, this time with accurate tracking on the constraint system:
There is an inverse relationship between the percentage of players who have full synchronization and the average number of reinitializations associated with the mission.
This confirmed for us that players were indeed reinitializing as an attempt to reach full synchronization on a mission. While the average number of reinitializations may seem low at a glance, this is an average of all players and represents a significant number of players quitting a mission in progress. It also confirmed to the team that players were indeed using both the Replay and Constraint gameplay systems included in Assassin’s Creed Revelations. As a last reassurance, these missions line up perfectly with those constraints considered more difficult in playtest.
This is just one example of how long-term vision and tracking on a brand can help the developers make more informed decisions using player data.
Game Telemetry with Playtest DNA on Assassin’s Creed - Part 3
As seen in the first two parts, Ubisoft gathers data about player behaviour through telemetric systems to analyse and ultimately improve the overall experience of our customers.
This section will reveal more details on the functional challenges of doing analysis on game telemetry data and offer insights on the technical solutions available to game developers and analysts at Ubisoft.
.jpg/?width=700&auto=webp&quality=80&disable=upscale "AC3 - Tree Run")
In most industries, the goal of data analysis is to highlight useful information in order to support decision making. Whether trying to test existing hypotheses, for example in the analysis of the constraint system in Assassin’s Creed, or trying to discover new patterns in the data using exploratory analysis, data analysts use a specific workflow to reach their objectives. The software solutions we offer here at Ubisoft are tailored to that workflow.
Data exploration
The goal of data exploration is to allow analysts and designers to sift through large quantities of data in an attempt to reveal meaningful information, such as patterns, correlations, distributions, or even to identify outliers and explain them.
In order to do this the data must provide accurate contextual information, for example: the player’s current state, mission, and equipment.
By taking this data and visualizing it in an easily comprehensible way, it allows us to compare it to initial design intentions, or to simply examine trends and provide valuable analysis to the development teams.
To achieve this, game analysts need a responsive and interactive analysis experience that helps to find meaning in the data and allows them to iterate quickly with successive “what if” questions, in full autonomy.
The following example is from Assassin’s Creed: Revelations multiplayer, and shows the flexibility and versatility of our analysis tools when it comes to plotting data and exploring it in real-time:

This graph plots the average final score earned in a match against the number of kills the players make. The size of the bubble represents the player’s experience level, and the color shows the multiplayer game mode.
While this may seem like an eyeful at first glance, there are several relatively easy observations to be made:
The modes are generally well balanced for scoring despite the different gameplay styles and the varying focus between achieving team objectives and getting kills.
Chest Capture and Steal the Artifact stand out as the modes that offer the highest possible scores for players with a lower number of kills, while the Assassinate mode makes it a little more difficult to get a high score, requiring players to get a lot of kills.
Corruption, Wanted and Manhunt all have relatively tight grouping, which tells us those modes produce tight games independent of the players levels.
The bubbles increase in size as they move towards the top, showing that players become better at getting higher scores as they gain experience.
Those are just examples of the type of analyses that help developers adjust the game using title updates, or plan changes for the next installment of the game. This type of ad-hoc data exploration is an essential tool to discover new interesting facts about the game that were not necessarily obvious avenues of investigation when we set out.
Geographic representation
Whereas a typical business would look for sales data divided by country and zip code and represent those on a world or regional map, video game analysts need a way to represent their data in a representation of their virtual worlds, i.e. the maps of the game.
Our in-house tool, DNA Viewer, was inspired by best-of-breed solutions like Microsoft Pivot Viewer, Google Maps and Tableau Software and adapted to the reality of game telemetry. This tool allows us to easily create filtered data sets which are then plotted on the world map of the game, with visualizations and filters specifically tailored to the needs of our game analysts and designers.
This is particularly useful when using mixed-method research. In the following example, user research team members noted that some players were not taking the appropriate path which led to a descent via parachute, but instead descending by an unintended alternate path which bypassed the tutorial and was less fun. It is critical that players do not get lost this early in the game to keep them in Flow, and ensure they get the best possible experience.
The staff had difficulty pinpointing exactly where the players were able to go, and so turned to the viewer tool, which clearly illustrated their paths.

This image clearly shows six of the eight players parachuting as intended, but two other players making their way down via an unintended path.
Thankfully the tool is able to display both 2D overview maps, as well as 3D representations of the whole space. The 3D maps are taken directly from the developer’s production tools such as 3DS Max and integrated into our viewer, offering a perfect reproduction of the game world, with our data laid over it.
The level designer was able to easily fix the area to ensure that the players took the proper path and used the parachute as intended. This resulted in a more streamlined and enjoyable experience for the player.
Final words
As you saw in this series of three articles on game telemetry, Ubisoft has invested heavily in the use of telemetry as a tool to improve our games. As such, we are continuously improving and developing new methods and technologies to better serve the development teams who use the information gather to create better games. Some upcoming projects include a new version of the viewer with better filtering and data exploration capabilities, a central database to collect all sources of data, and other exciting new projects. These new technologies will be used for the upcoming Assassin’s Creed 3, as well as other future projects.
Read more about:
Featured BlogsAbout the Author
You May Also Like