

Daily news, dev blogs, and stories from Game Developer straight to your inbox
Sponsored By
From 20 to 380: How to conduct cross-analysis in game user research?
This blog will briefly introduce what cross-analysis is and its applications, as well as demonstrate how to conduct cross-analysis in game user research.
10 Min Read

Questionnaire is a commonly used method in game user research, which can quickly collect data with large samples (in most cases). Although the number of questions and the type of questions to be set in the questionnaire are determined by research objectives, usually you should control the number of questions to around 20, with a maximum of no more than 30.
That being said, does a questionnaire with 20 questions only provide 20 pieces of information? Of course not! Cross-analysis can enable limited questionnaires to provide more information and achieve greater effectiveness. From a purely mathematical perspective, 20 questions can produce over 380 results when cross-analyzed. How can meaningful cross-analysis be used in game research to gain a deeper understanding of players?
This blog will briefly introduce what cross-analysis is and its applications, as well as demonstrate how to conduct cross-analysis in game user research.
1.What is cross-analysis?
Cross-analysis is a data analysis method used to analyze the relationship between two variables. This analysis method crosses two or more indicators to find the relationship between variables and discover more data features.
The following example illustrates what cross-analysis is.
A game research questionnaire has two questions:
1. Based on your recent gaming experience, how satisfied do you feel with the game?
a. Very Dissatisfied
b. Somewhat Dissatisfied
c. Neutral
d. Somewhat Satisfied
e. Very Satisfied
2. What is your gender?
a. Male
b. Female
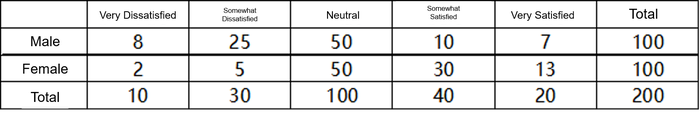
Let’s say total of 200 questionnaires were collected, and the results of the data for each question are as follows (not real data and not statistically significant):
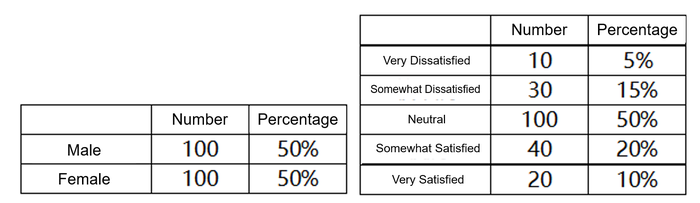
At this point, the results we can see from data analysis are that the gender ratio of the game is close to 1:1, and overall satisfaction is higher than dissatisfaction rate. When we cross the variables of gender and satisfaction, we will obtain the results of cross-analysis, which is the analysis after combining these two variables.

2. The Significance of Cross-Analysis from the Perspective of the Simpson Paradox
It is not difficult to see the significance of cross-analysis from the above case. Single variable analysis alone would conclude that players are more satisfied than dissatisfied with the game. However, through cross-analysis, it is found that male and female players have completely different evaluations of the game. Male players are mostly dissatisfied with the game as a whole, while the positive feelings from female players raise the overall satisfaction level.
The significance of cross-analysis lies in the fact that through this analysis method, we can have a clearer understanding of the views of different types of players/users towards the game/product, and prevent the excessive integration of data from concealing real data. The so-called concealment and loss of real data can be more clearly perceived through the 'Simpson's paradox'.

We encountered the "Simpson's Paradox" when analyzing the paying rate of a game. (The following data is not real) In this game, the paying rate of scenery-oriented players is much higher than that of outfit-oriented players in the overall gameplay, with the former at 44% and the latter at only 28%. Before concluding that scenery-oriented players are more willing to pay in the gameplay than outfit-oriented players, we found that the paying rates of the two gameplay modes - A and B - that make up the game were both higher for outfit-oriented players than for scenery-oriented players.
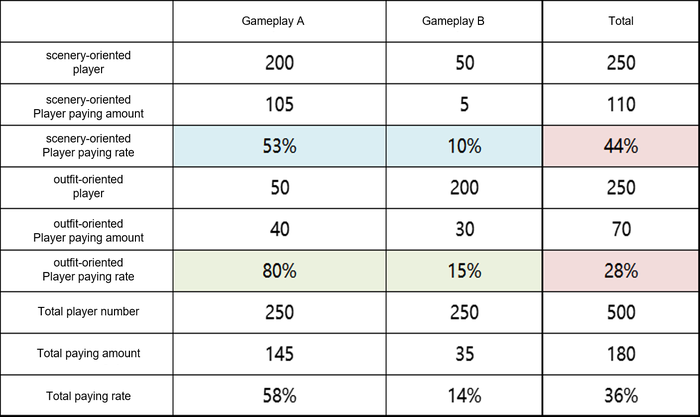
In gameplay A, the paying rate of outfit-oriented players is 80%, higher than the 53% of scenery-oriented players. Similarly, in gameplay B, the 15% paying rate of outfit -oriented players is higher than the 10% paying rate of scenery-oriented players. However, in the overall game, the paying rate of scenery-oriented players is almost twice that of outfit -oriented players.
This is a typical "Simpson's Paradox", where the overall trend and the trend of the categories are completely opposite.
Why does this happen? Because when viewed by gameplay, the paying rate of gameplay A is very high (58%) while the paying rate of gameplay B is very low (14%). In this situation, scenery-oriented players participated in gameplay A in large numbers while outfit-oriented players participated in gameplay B in large numbers. Failing to distinguish between gameplay categories loses the meaning of the data, pushing the overall research insight to the other extreme.
3. How to do cross-analysis in game research?
Theoretically, any two variables can be cross-analyzed, and a questionnaire can yield hundreds of cross-analysis relationships, but many of these may not have practical significance. In game research questionnaire, the key to cross-analysis is actually to classify players using different criteria and then analyze the data of different types of players. Therefore, usually the core of cross-analysis in game user research is how to classify players.
Based on the features of game players and data, this blog divides the classification methods of cross-analysis of game questionnaires into three categories.
3.1 Cross-analysis based on demographics
The most common way to classify players is based on demographics, including gender, age, income, occupation, and region, etc.
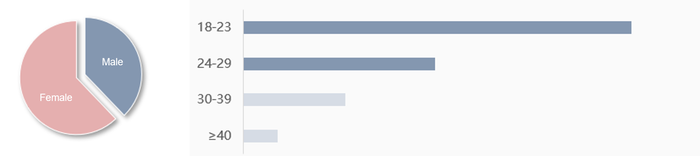
Most surveys collect demographic information at the end, including surveys for game user research. After collecting the survey samples, data analysis is conducted, including the proportion of gender and age segmentation, but demographic information provides much more than that.
How can we use demographic information for cross-analysis in games?
Gender is the most widely used factor in cross-analysis of game surveys. Male and female players exhibit different attitudes towards game genre selection, graphics preferences, and pursuit of game fun. For example, in a survey analysis, classifying players by gender can reveal that female players are particularly concerned about the style of graphics and game pacing, while male players pay more attention to game themes and the investment of money and time (i.e. game value for money).
When conducting research on media usage of players, we found through cross-analysis that females prefer social medias, while males tend to prefer live streaming platforms. This discovery of media preferences has inspired us to create appropriate marketing materials for our game and attract players on the appropriate platforms (not all options were shown in the data).
Population factors such as age and income of players are often seen in the cross-analysis of game questionnaires, but factors such as region are not commonly seen. The reason for this is that region is largely correlated with income, and categorizing based on these factors may not reflect differences caused by regional cultures but rather the overall economic level.
3.2 Player classification questions designed in the questionnaire
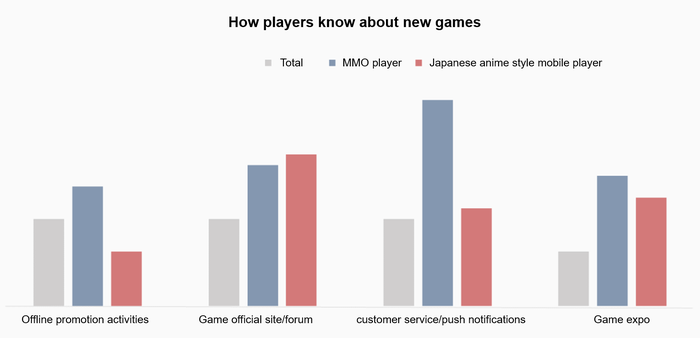
In addition to the demographic questions on the "fixed settings" in the questionnaire, researchers can also add meaningful player classification questions when designing the questionnaire, which facilitate useful cross-analysis after data collection. We once asked about players' gaming experiences in the questionnaire as a basis for distinguishing different types of players. By comparing the information channels of exposure to new games between MMORPG mobile game players and Japanese anime style mobile game players, it can be seen that MMORPG mobile game players receive more customer service or push notifications from game companies (not all options are shown in the data).
In addition to the background of gaming experience, we have also used multiple indicators such as player recommendation indicator and player damage/ranking to divide players into different groups, and then further analyze the attitudes of different types of players.
3.3 Classification of player game data corresponding to questionnaire collection
The demographic information mentioned above and the pre-set player classification questions are all based on the results of questionnaire collection to classify players. In fact, after the data collection, we can also divide players according to game-related data such as their level and guild in game, to understand the thoughts of these players.
4. Common indicators in cross-analysis
There are two common types of indicators in cross-analysis: row/column percentages and TGI index.
4.1 row/column percentages
Taking the cross-analysis of 'gender × satisfaction' as an example, as before:
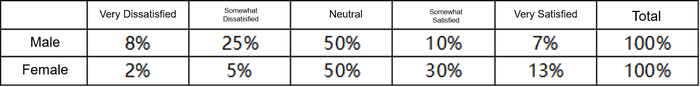
Row percentage refers to the number of samples that cross two variables divided by the number of samples in the corresponding row. It reflects the data difference of the row variable classified on the column variable, with the row variable as the main variable (e.g., the difference in satisfaction between men and women).
Column percentage refers to the number of samples that cross two variables divided by the number of samples in the corresponding column. It reflects the difference in data between different column variables on the row variable (in the example, the difference in gender between players with different satisfaction levels).
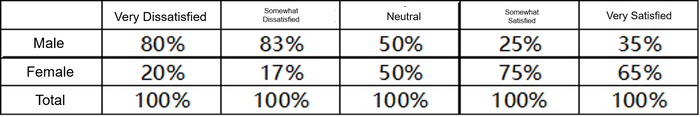
When analyzing, the choice between row percentage and column percentage depends mainly on whether the indicator has practical significance or not. In cross-analysis of some variables, both row/column percentages have a certain meaning, but not the same in other cases. In the case mentioned above, the row percentage reflects the difference in player satisfaction under gender differences, while the column percentage has no practical significance.
4.2 TGI index.
TGI stands for Target Group Index, which reflects the strength/weakness of a target group within a specific range. TGI = the proportion of groups with a certain feature in the target group / the proportion of groups with the same feature in the total population * 100%.
When TGI = 100%, it indicates that there is no difference between the group with a certain feature and the total population;
When TGI> 100%, it indicates that the group with a certain feature is more dominant than the total population, and the strength increases as the number increases;
When TGI <100%, it indicates that the group with a certain feature is weaker than the total population.
Taking the cross-analysis of "gender x media usage" as an example, the results obtained from asking players which platform they use more frequently on a video platform and a live streaming platform are as follows:
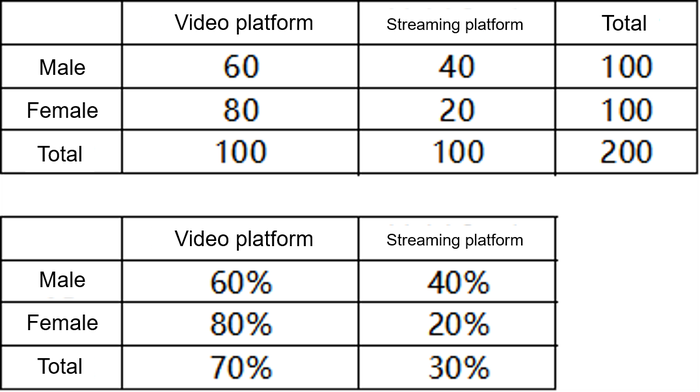
At this point, whether looking at the overall situation or by gender, players tend to use video platforms more frequently. Is this all the information we can obtain? The TGI results provide another aspect of information:
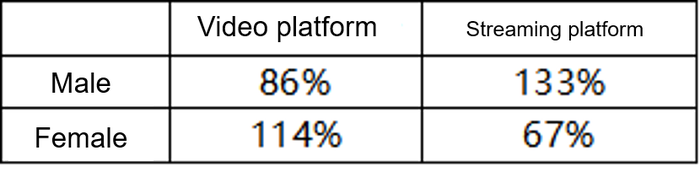
Taking 86% as an example, 60% of male players choose video platforms, and 70% of overall players choose video platforms. The TGI index tells us that male players are more likely to use live streaming platforms, while female players are more likely to use video platforms. This index reflects the bias of a certain group relative to the whole.
5. Summary
In fact, there are many scenarios in which we can use cross-analysis during the data analysis process. Many people know what cross-analysis is, but they don't usually use it in specific scenarios, especially in game data analysis. Therefore, this blog briefly introduces the meaning of cross-analysis and then intuitively demonstrates its significance through the "Simpson's Paradox" and game data examples. Then, I summarized the commonly used player classification methods for cross-analysis in game user research, and finally introduced the practical indicators of cross-analysis.
Read more about:
BlogsAbout the Author(s)
You May Also Like


.jpeg?width=700&auto=webp&quality=80&disable=upscale)


