

Daily news, dev blogs, and stories from Game Developer straight to your inbox
Sponsored By
“Read player’s mind through eyes”: how eye-tracking works in game user research
Eye-tracking, as an objective method, can measure the player's pure experience and supplement the player's response during interview.
8 Min Read

In game user research, this is what’s often happening: after the process of playtesting, a player is asked about certain details and can't answer questions like "Does this function exist?" or "Did I control like that?" or "Why did I do that?". At this moment, researchers may feel helpless and wish they could read players’ minds.
Once players forget some details, problems observed by researchers may not be resolved. Fortunately, eye-tracking, as an objective method, can measure the player's pure experience and supplement the player's response during interview. Combined with traditional subjective research results, eye-tracking can avoid some deviations caused by player subjective feedback to some extent. So, in terms of user research practice, how can visual attention data be applied to game design and user experience research?
1. How eye-tracking works in game research
1.1 Player attention distribution can be obtained from gaze point data.
Eye Movement means the process of discovering, observing, and tracking visual stimuli through the movement of the eyeball. Eye-tracking involves two aspects: one, observing where the player is looking at and how to measure the player's eye movements. The gaze point is what the eye-tracking device calculates through infrared light to show where/what the player is looking at in real-time on the monitor.
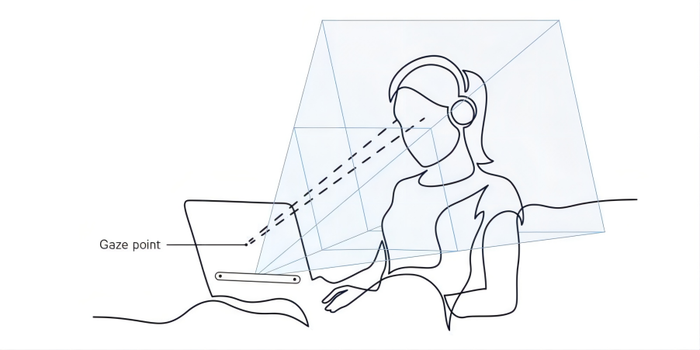
Secondly, where is their attention when they clearly see the prompt?
In fact, the player's eye movement and attention distribution are closely related. By observing eye movement trajectories and behaviors, we can restore the reasons why players did not make a movement in time, such as more urgent incentives (small monsters rushing forward, pickups nearby).
Simply put, eye tracking is to display the player's gaze point in real time on the screen, and present this performance in the form of data afterwards; researchers or designers can intuitively understand which information the subject has looked at, which ones have not been looked at, and how long a certain information has been viewed. It can serve as direct evidence for interface and prompt optimization.
1.2 Eye-tracking research can complement objective behavior data.
At first glance, eye tracking seems to be able to provide a lot of detailed data, but what are its advantages or differences compared to commonly used research methods? As a type of behavior data measured through modern technology, eye tracking can address the following issues:
- High reading cost of testing results: Eye tracking data can be presented visually using heat maps, which greatly reduces the reading cost of raw data, making it easier to read even for those who have not been exposed to eye tracking.
- Subjective speculation of player behavior details: Eye tracking data avoids situations where players have to recall and interpret specific details when they play, preventing players from speculating on details afterwards.
- Frequent interruptions in the process by the moderator: Using other methods, the moderator may need to interrupt the player frequently to ask for details about their experience. Eye tracking ensures that players can finish the playtest without improper interference, especially in immersive scenarios.
2. Commonly used eye movement indicators in practical applications.
As mentioned above, the data obtained by eye tracking has a high accuracy (can be divided into small pieces of data) and is very comprehensive. It can be used to implement various types of analysis according to the needs of researchers. In user research practice, there are three types of data that are used more frequently:
2.1 Eye-tracking video: High analysis efficiency, can address many potential problems.
Eye-tracking video is a recording of the player's gaming experience along with real-time gaze data. Researchers can use software to clearly see where the player focused real-time. By watching the video, researchers can reconstruct changes in a player's attention during any given period of playtesting time. It is the simplest and most efficient way of analyzing eye-tracking metrics. Specifically, researchers can see where the player looked, where they didn't look, what content they were interested in, and the order of their attention.
2.2 Heat maps and gaze plot: visualize the problems in the video and facilitate comparison.
Heat maps and gaze plots are both visual tools that reflect the player's gaze over a certain period of time, and they are relatively intuitive to use. If a player's gaze time (frequency) is long, it will be displayed as red on the heat map, emphasizing the overall attention and relative density. The gaze plot can display the order and the track of all gaze points of the player. This indicator is mainly used for the validation of existing interface designs and is usually used to study interfaces or pictures/posters.
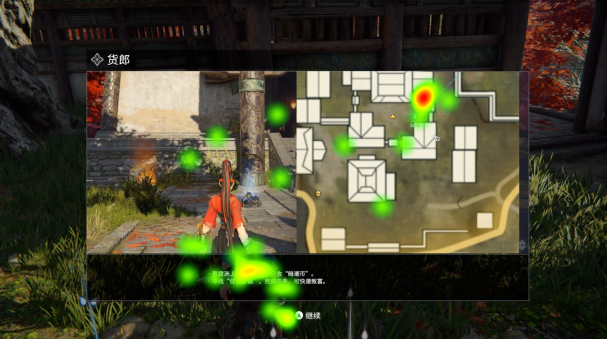
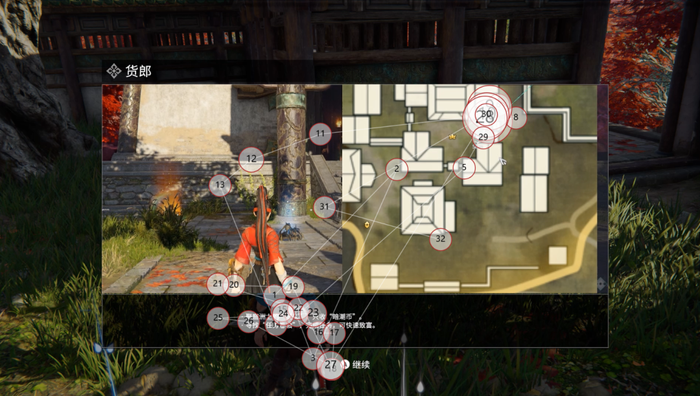
For example, in the above picture, when observing players' understanding of the store tutorial, it can be seen from the heat map that players pay extra attention to the store icon on the map (highlighted in red in the above figure), and from the gaze plot, it can be seen that players read the text and watch the video as well.
2.3 Quantitative indicators - first fixation time and fixation duration are the most commonly used.
Quantitative indicators can be exported through eye-tracking software, and the obtainable indicator data includes a series of data such as fixation, visit, saccade, etc. These indicators are often used for quantifying user behavior research. Among these, the two most commonly used and easy-to-use indicators are:
- Fixation duration, that is, the duration of player's fixation in a certain period of time, generally indicates the player's interest level. The longer the fixation duration, the more interested the player is in certain position.
- First fixation time, that is, the time when the first fixation occurs, which can show whether the player pays attention to the content first and how long it takes. Based on the first fixation time, we can analyze the reasons for player's time consumption of attention, the distribution of stimuli, and other related UI design elements, so as to adjust the prompt position, intensity, and other user interface design.
The above three types of indicators have their own goals and can complement each other. The recommended analysis process is to first watch the eye movement video to identify possible problems; then use heat maps and gaze plot to visually identify specific problems; if necessary, then conduct in-depth analysis through quantitative data.
3. How to interpret common eye tracking metrics in practical game research applications.
3.1 Directly analyze through eye-tracking videos.
As mentioned above, eye-tracking videos are the most intuitive and efficient indicator. By combining player behavior, eye-tracking video, and interface information, many problems can be discovered.
In the tutorial test of the console version of "Naraka: Bladepoint", after defeating the enemy, the player didn't know what to do and randomly walked around for a while before suddenly using the Y skill and then moving on to the next stage. Through eye-tracking, we saw that in this stage, the player only saw the prompt in the upper left corner of the screen at the very end, which led to the failure to achieve the task goal and he got stuck. It shows that the player did not discover the task prompt as expected, and researchers may need to further verify the existing UI design via multi player tests.
3.2 Comparative analysis through different players.
By comparing, we can also use certain player features as variables to see the possible problems of a certain group of players. For example, in the eye-tracking test of the mobile game "Meteor, Butterfly and Sword", veteran players are more familiar with the game's UI and task flow, so their gaze plot can be used as a reference for other players when using it. By comparing it with the eye movement of new players, we can find the differences in the content they focus on.
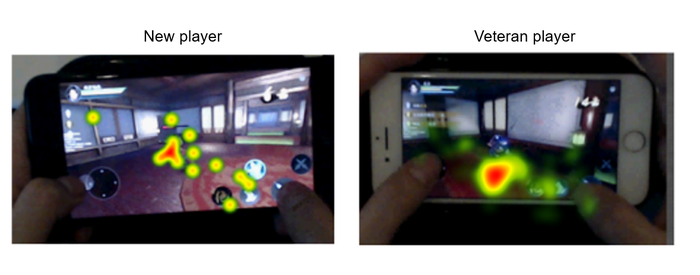
From the eye-tracking data, we saw that veteran players pay attention to the requirements of the a mission from the beginning, while new players do not pay attention throughout the level; veteran players' attention indicates that this is an element that is highly valued when clearing the level, and the fact that new players did not see it indicates that the information was not prominent enough when they first played it. Comparing the gaze points of new and veteran players helps the development team optimize issues related to players getting started.
4. Summary
Eye tracking is a type of behavioral data that complements qualitative interviews. Researchers can precisely identify and analyze problems through eye tracking videos, data visualization, and other raw data.
From a practical perspective, eye tracking is the same as other user experience research methods, requiring a clear research plan, reasonable and measurable hypotheses for the problems to be explored. And player interviews after eye-tracking testing to obtain persuasive conclusions and form inspiring insights are sometimes needed as well.
Read more about:
BlogsAbout the Author(s)
You May Also Like


.jpeg?width=700&auto=webp&quality=80&disable=upscale)


