

Daily news, dev blogs, and stories from Game Developer straight to your inbox
Sponsored By
Optimizing performance of Unity games: A battle tested plan
An article about optimizing performance of Unity games. Battle tested on 9+ platforms in our 13+ years of Unity game development experience.
16 Min Read

For the last 12 years I’ve been running our own game studio M2H. My background and passion is the tech around game dev, anything from multiplayer to performance. It has always been hard to find programmers that have a good feeling for, and experience with, optimizing Unity games. Few programmers build up this experience because there’s little time for optimization. It’s often done as a necessary rush job at the end of a production cycle, despite it being such an important subject. Existing articles often provide a lot of pointers on what you could optimize, but don’t teach you how to figure out what makes sense for your game. As we’ve just wrapped up development of our latest game, optimized for 9 platforms, it was a good time to write down some of our techniques. In this article I’ll present a plan that can be used as a base to profile any Unity game and I hope this can be a start to make your profiling work easier!
There is an overwhelming amount of optimizations you can make which are impossible to fully cover in this article. Therefore we focus solely on an analysis method you can use, this will inevitably point you to the right optimizations to make for your specific game.
Common mistakes
Let’s get started with some no-go’s to get some common mistakes out of the way. As usual there are exceptions to these rules but as long as you’re new to optimizing you’d do best to treat the following items as no-go.
The rush job a few days before deadline
It’s really not doable to fix performance days or even weeks before your release, especially not because sometimes you might have to completely change how certain systems work. A game doesn’t have to run a solid 60 FPS during all phases of production, but at least keep it somewhat close to your target at all times to prevent a huge workload and overhauls in the last weeks.
No plan: Going in blind or making assumptions
Stop profiling or optimizing without a plan. It doesn’t make sense to go in blind and optimize code or art without having measured that these are your actual bottlenecks.
Don’t make random profiles in your editor, or simply on your own PC, as these don’t represent your target platform at all. Also don’t keep switching between profiling targets, you need to decide on what your main target(s) are in order to make important decisions around performance goals. We can make optimization much more fun and satisfying with a simple plan.
I often see programmers optimizing various random bits of code, optimizing a UI foreach over some list from 10ms to 3ms. Another example would be artists crunching poly counts. Both sound like improvements but often don’t produce any noticeable results. You should instead focus on the player experience which is the only result that matters.
Misleading data when enabling the “GPU” Profiler Module per default
Enabling the “GPU” in the profiler will show unusable results on some platforms so it’s best to disable it per default (The issue being that VSync will use up 90%+ of your frame, and stuff like “GPUProfiler.EndQueries will incorrectly appear to cause huge workloads). Only use the GPU profiling to dive deeper into a situation when you know why you’re looking here.
Note that you can figure out your GPU or CPU bottleneck by solely using the CPU profiling timeline:
Gfx.WaitForPresent: GPU bound, the CPU is waiting on the GPU
Gfx.WaitForCommands: CPU bound, GPU is waiting for the CPU.

Even Unity tells you so!
Misleading data when using the Unity profiler option “Deep profiling”
Stop using this option until you know when to use it. Never base your performance timings on Deep profile results. Only use this if you already know you have an issue with some specific code, you can then enable Deep profile to easily identify what’s being called here, the timing results are not usable because deep profile adds incoherent overhead to small methods, skewing all results in a weird way. Placing your own profile markers can be a useful alternative or addition to Deep profiling.
UnityEngine.Profiling.Profiler.BeginSample("MyHeavyCode - Top");
..
UnityEngine.Profiling.Profiler.EndSample();
Using custom profiling markers
Misleading data because of Physics FixedUpdate
Profiling overhead itself can greatly exaggerate certain data. Because the profiler adds overhead, your game will perform less, which will cause more Physics FixedUpdates to run in relation to normal frames, even though the profiler will then show physics to use something like 33% of your frametime, it will be closer to 10% in your actual release build. Similar to deep profiling this fools you into optimizing the wrong parts of your game, there can be more efficient gains to be made.
Blaming Networking Calls
When working on our multiplayer games we’ve seen a common mistake where a new programmer blames the networking tool (Photon & others) for being very heavy on performance. What they are seeing is CPU spikes from the networking solution but forget to look any deeper in the call stack. The network tool is actually running methods called from the network(often called “RPCs”) which is completely your own gamecode and has nothing to do with networking. In these situations you’d just have to optimise the game’s RPC methods and/or spread out their workload.
The optimization plan
Now that we can continue with a fresh slate, here’s the outline you can use for your (multi-platform) game:
I’d like to say that every good programmer should make every problem “finite”. Especially something as daunting or seemingly endless as profiling. Using this plan will make your performance gains measurable and gratifying.
Preparation 1: Pick your weakest platform and keep using this as base:
First, take a step back and decide on just one specific PC or platform to profile, ideally this should be your weakest device. Recently we’ve often used Xbox One because of the slower disk and the older CPU & GPU (Switch and mobiles can compete quite well with the XboxOne nowadays).
Preparation 2: Make yourself comfortable:
An important side-step is to create yourself a comfortable profiling environment. Do everything you can to increase the speed of your builds and runtime. Since you’ll be making many builds this time will pay off and will immediately be useful for other development tasks like bug fixing.
Most important common tweaks:
Automise your builds to be one click.
Skip unimportant game content, have debug builds skip the splash screen video for example.
Create an easily extendable development-only debug UI. One use case is being able to add many separate buttons to toggle certain tasks on & off for profiling without having to rebuild.
Speed up build time
Ensure that there’s a build option to build quicker and smaller development builds (i.e. include only one level and one car in a race game)
If used, disable obfuscation.
Platform specific tweaks: Browse through all Unity “Player Settings” for some settings that can help. I.e. one specific high end console platform has build compression levels which can be disabled for quick build iterations.
Speed up the Il2CPP compiler config: Use Release, or even Debug if you’re not bottlenecked by code.
PlayerSettings.SetIl2CppCompilerConfiguration(group, mode);
Il2CppCompilerConfiguration.Master //Slow build, Quick performance
Il2CppCompilerConfiguration.Release //Medium build time, Good runtime performance
Il2CppCompilerConfiguration.Debug //Quickest build, slowest runtime performance
The optimization loop
The core part of the optimization task is to only keep improving the current biggest and/or easiest bottlenecks, don’t try to fix every issue at the same time as after your first batch of fixes you’d best make a rebuild, verify your improvements and then completely start over and repeat the cycle until you’re happy with performance or your time ran out ;).
As build time and capturing profiling data is so time consuming it is useful to combine a pass of improving your baseline and improving spikes, before rebuilding and verifying.
Step 1: Document your performance
Capture the performance of your game, preferably in one or more stages of your game which have easily repeatable conditions.
Document the results and save your profiling captures. It will be interesting to write down the CPU (and GPU) times in order to measure your progress. I’d often also include memory usage here to make good use of all the rebuilds we’re making and do some quick memory reductions if required.
You can use the “Profile Analyzer” package to make it easy to compare two areas in a profile, or even compare between two different captures. This can help you to easily spot spikes or changes between two builds/settings. This is the tool you can use to prove and celebrate all the improvements you made.
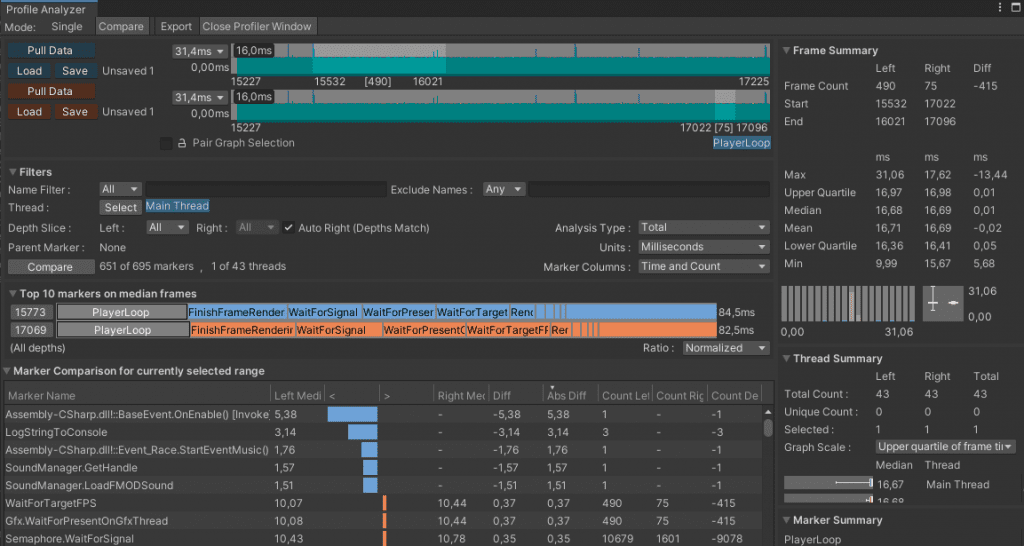
“Window -> Analyse -> Profile Analyzer” saves you a lot of work; select two regions and have it automatically tell you what the differences are.
Step 2: Baseline performance:
First we mostly ignore spikes, but focus on attaining a healthy baseline performance. This also creates room for some minor spikes. The goal is to get the “normal” game loop to a healthy level, be it 30(Mobile, Switch?), 60 or even 120(VR) frames per second..
Use the Unity profiler to find out what’s affecting your baseline performance and address the most important issues only.
Use the ‘timeline’ view to get a clear picture of how your game really works, performance wise.
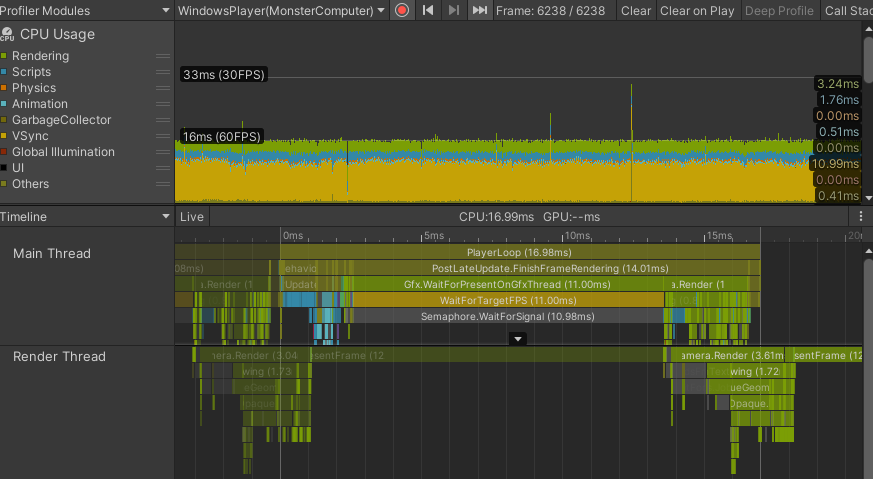
Window -> Analysis -> Profiler: The profiler “timeline” view is much more useful then the “Hierarchy” view as it can help you show the order and dependencies of tasks.
Common issues to check for:
Your own scripts/plugins running expensive code in Update(), FixedUpdate, LateUpdate etc.
Audio: A common CPU target usage for audio is a maximum load of 5%. Ensure you’re not playing sounds that aren't even hearable.
Inefficient UI implementation (not using canvasses correctly would cause a lot of redrawing on CPU)
Running animations that aren’t even visible.
Optimize your Physics Fixed deltatime setting. Not too low (buggy physics) and not too high (wasting critical performance). Also only use FixedUpdate() for code that must really run in physics-time as it’s heavily taxing on your FPS.
It’ll also be a good idea to make a release build every now and then to verify your actual frames per second compared to the slower development builds you’re working with.
Step 3: Spikes
Spikes are easy to identify because they are so obvious. Again, use the timeline to help clarify why something is taking very long. Spikes are often asset loading related, i.e. make sure to test the game on a device with a slower hard drive (not SSD) to make any loading bottlenecks clear.
Remember that you do not have to fix all spikes, sometimes you can simply spread out the load of a spike. A very satisfying and easy optimization we recently made was on a last gen console platform. We were calling the platforms native Main(); calls via a Monobehaviour Update(); method (to update the platform and it’s 4 controller states). This cost us 2.0ms which is a lot on a 16ms target. We were able to optimize it to about 0.2ms by spreading this out to run only every X-th frame. It did nothing that needed to run in every of our frames. We also only update maximum one controller state per frame instead of all four at once. By making use of modulo on your Time.frameCount you can easily spread out a lot of different operations over your 16 frames per second.
An interesting recent sample of loading spikes: I was asked to help improve the performance of another studio's title. Their baseline performance was quite OK, but they had huge lag spikes while moving around the game. The level was split up in chunks that were loaded and unloaded dynamically, I believe that was setup to reduce GPU load. However (now) their bottleneck was the CPU. The fun thing was that this was a really easy spike to fix: As the game was around 2.5gb it would completely fit in the memory of consoles so a fix was to stop using the “streamed” level chunks (un)loading and just keep everything active in memory.
Step 4: Repeat
Rebuild with your improvements and start over from step 1. This time compare your new results with the previous results and find the new most efficient bottlenecks to address.
What to optimize
There are way too many optimizations you can make, which is why this article hands you the method to find your bottlenecks so that you are able to spot your bottlenecks yourself. As soon as you are aware of your problems you will be able to make the changes that really matter in your specific game.
GPU bottleneck: Dynamic resolution. You can use this as a stopgap solution to get to a releasable state (GPU wise) quite easily. You can have a script check your CPU & GPU frametimes, and as long as GPU is the bottleneck, reduce the resolution of your game cameras (but not your UI). Once you have this under control, you can optimise GPU to be less dependent on this tweak and start increasing visuals. This only applies if you are fill-rate bound on the GPU, which is often the case.
CPU spikes: Use “incremental Garbage collect”. With this new Unity feature you might not have to reduce your GC allocs. A common issue for CPU spikes is the GC collect lag spike, enable this Unity feature to greatly reduce the GC spikes. Note that in our own projects we had to disable this feature on a few platforms because of Unity crashes (Switch - Unity 2019.4).
CPU bottleneck: Just stop using Unity Occlusion Culling by default. It sounds like a great tool but in practice we only improve our games by disabling occlusion culling completely. Every single Unity game we’ve released is always CPU bottlenecked. The built in occlusion culling has a CPU overhead and unfortunately our games performance only ever improved after disabling occlusion culling completely. As always: This will vary per game, but please don’t forget to actually verify if using occlusion culling is helping you or slowing you down.
GPU&CPU: SRP Rendering pipeline
While our games often use Deferred rendering on high end platforms. It had proven beneficial to switch back to Forward on lower end devices (Mobile, Switch, XboxOne, PS4) as the performance advantages of Deferred only become apparent when using multiple pixel lights which is not the case for our game on these lower end devices.
What about HDRP/URP?
While the new HDRP&URP rendering pipelines are advertised to improve performance, in practice we haven’t heard of other game developers that got a “free” performance improvement (rather the opposite). As of July 2021 at M2H we think it’s still too early to use the new pipelines.
GPU&CPU: Frame Debugger
The Unity frame debugger is also a must use. Similar to the profiler timeline view, this tool helps you understand how your game actually works by visualizing it. Drawcalls cost CPU time to process so you’ll want to reduce these. Key here is reducing drawcalls, merging shaders and/or materials, usage of GPU instancing and dynamic & static batching.
The frame debugger also helped us track down nasty bugs where objects, or the entire screen, turned black: By scrolling between the drawcalls you can find out exactly when and how something is rendered.
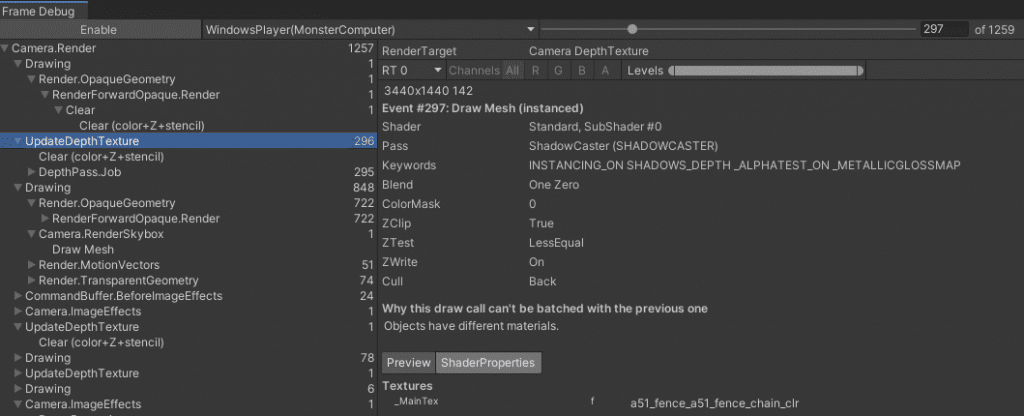 The Unity frame debugger
Other
Similar to occlusion culling there’s two more settings you could verify before using:
Unity “Graphic Jobs” player setting: It’s not always a life saver and we’ve had to disable this on quite a few platforms because of Unity crashes (Particle jobs are buggy). As always, verify performance improvements before enabling it.
Dynamic batching: I’ve seen Unity staff mention this was assumed to only still be useful for old devices. This could again cost more CPU overhead than whatever it gains for you on GPU. I’ve not yet been able to measure clear upsides or downsides of this setting.
Do you need other tools?
There are some other tools which we’ve used in the past, from PIX (Xbox) to Intel VTune. However today the Unity profiler already offers all the tools you need for your most important changes. For some specific platforms you can of course use the native tools (PIX, XCode, Android Studio etc.) to easily access the device information directly, but I want to reassure you that the built-in Unity tools that are available to you can be sufficient to get the work done.
About the CPU bottleneck
All of our own Unity games are almost always CPU-bottlenecked. If we’re ever GPU bottlenecked that's usually because we just didn’t implement any basic optimization. The problem with Unity is that it’s still doing so much on just one CPU thread, while machines often have 8 cores nowadays. So we never get to use more than like 25% of the CPU’s actual power... This is why features like “graphic jobs” are important. Burst/Jobs/DOTS should be the future solutions here, but as of today at M2H we have not found this practical and/or usable for our games yet.
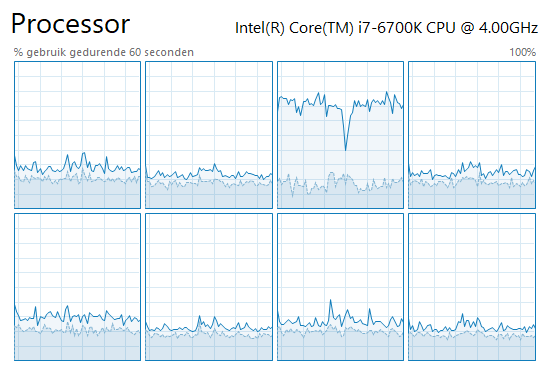
Task manager view of a typical Unity game, bottlenecked by CPU 3 (Unity’s main thread).
Related topics
Reducing memory usage and fixing OOM crashes
If you’re working on a game's performance you’ll most likely also be the person to run into OutOfMemory crashes or slow loading times because of unoptimized assets. While memory use is not necessarily directly impactful for performance, it’s still important and optimizing memory can be best combined while making all these optimization builds. Use the Memory Profiler for a clear overview of your current memory usage. Protip: Good chance your Shaders are eating 50% of your memory and you’ll have to dive deeper into proper shader keyword stripping, this is another topic in dire need of it’s own practical article.
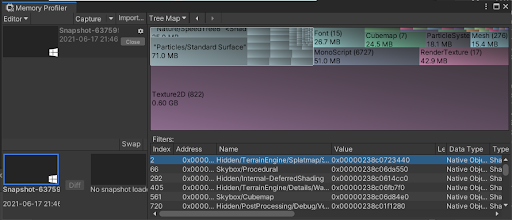
Window -> Analysis -> Memory Profiler can give you a clear view of your memory usage.
Closing notes
I hope this article helped you get started optimizing your game, or at least help you think about a more efficient mindset/approach to profiling. Good luck diving deeper into your game.
This article has been written after quite some performance work on our latest announced title Crash Drive 3 (check it out!). We’re releasing this game on 9 platforms simultaneously this thursday July 8. An article on how we managed to port and simship all these platforms will follow very soon.
There are a lot more advanced Unity topics that lack documentation and practical information, if you’re interested in more topics like this follow me on Twitter or LinkedIn.
I would love to hear from you if this helped improve your game!
Mike Hergaarden
P.S.: We recently had our brand new office built in Alkmaar, the Netherlands. Are you based in the Netherlands? We still have open game developer positions at our studio!
Originally posted on: https://www.m2h.nl/optimizing-performance-of-unity-games/
Read more about:
BlogsAbout the Author(s)
You May Also Like


.jpeg?width=700&auto=webp&quality=80&disable=upscale)


