

Daily news, dev blogs, and stories from Game Developer straight to your inbox
Sponsored By
Featured Blog | This community-written post highlights the best of what the game industry has to offer. Read more like it on the Game Developer Blogs or learn how to Submit Your Own Blog Post
Introduction to The P3 Optimization Framework
You need a higher frame-rate... but how? Introduce yourself to the P3 Optimization Framework
14 Min Read

[Check the original blog post at The Gamedev Guru: Introduction to The P3 Optimization Framework]
Welcome to this lesson on the P3 Optimization Framework.
Before we get into the abstract world of theory and bla, bla, bla, let’s start with one simple question:
Why do we need high-performing projects nowadays? The simple reason is:
Users demand more & more performance (oh, and your boss too).
Just look anywhere on the Internet, you’ll see a trend with increasing frame-rate and display frequency requirements:
Monitors popping up with 240Hz
Mobile phones spawning with 120Hz
Quest 2 now supporting 120Hz
So players expect higher frame-rates from your project. It’s only natural.
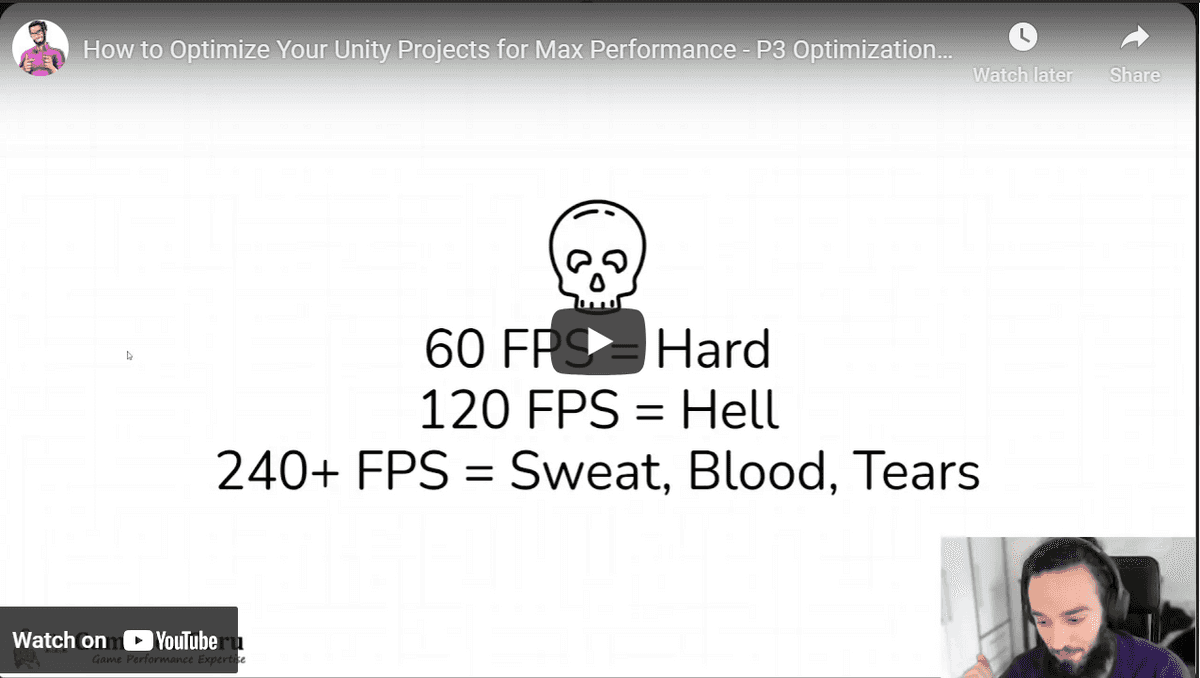
The problem with this is that rendering at 60 FPS is already hard.
And if 60 is hard, well, achieving 120 FPS is hell.
You only have 8ms to reach 120 FPS.

And if we are talking about 240 FPS: that is pure sweat, blood and tears.
But back to 120Hz: if you think 8ms is a lot of time, think twice.
Let’s assume that you are just drawing a cube. That can very well take 2ms of your CPU time due to a baseline cost. That leaves you with just 6ms.
And guess what?
Unity steals even more of that time to do physics processing, animation, UI, etc..
So suddenly rendering your project within 8ms becomes... let’s say, challenging.
OK, so what can we do about this?
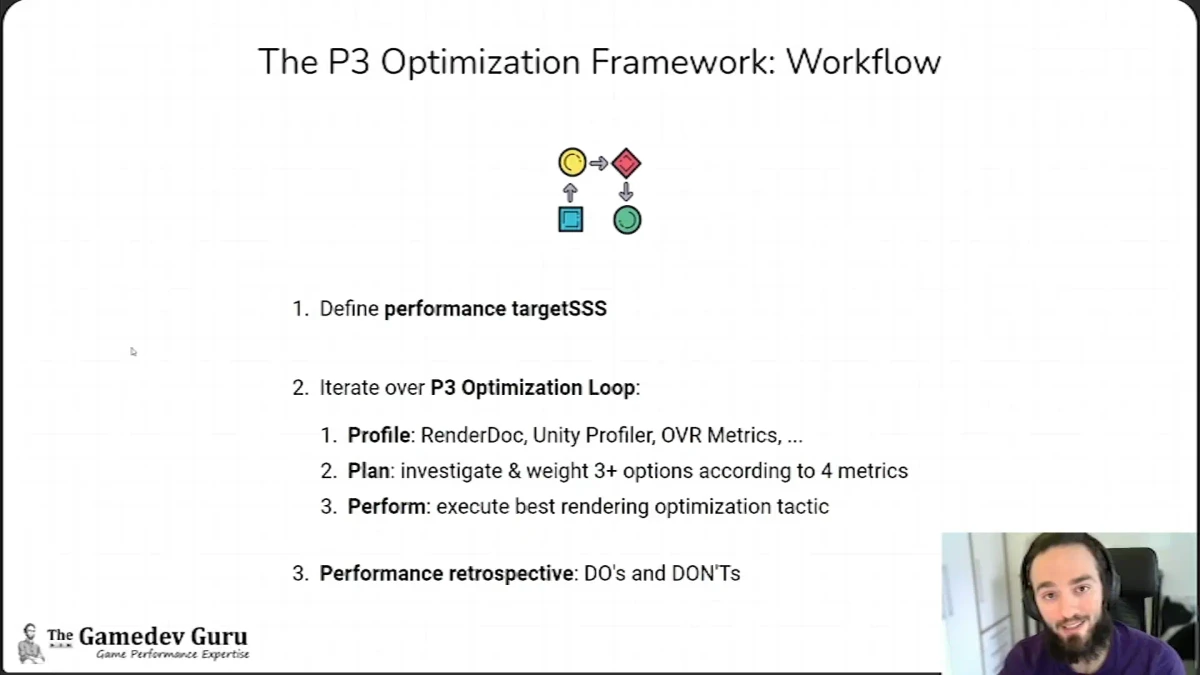
Table of Content
Why Do You Need a Unity Optimization Framework?
Well, performance optimization becomes exponentially painful when you go above 30 FPS. Especially if you are not experienced in optimization.
So what you need is to follow a structured optimization process that lets you ship a high-performing project.

A framework that whispers in your ear what your best next step is at any given point in your Unity optimization journey. A framework that takes you from zero to 72 FPS, from 72 to 90 FPS, from 90 to 120.
All in all, a framework that takes you from 0 to whatever else the market demands now... and in the next months.
An Overview
Just like an algorithm, you need a process that takes an input (profiler data) and produces an output (the best next steps to follow).
Let’s see the high-level overview of the P3 Optimization Framework
First, you want to define your performance targetsss*.
* I know how to spell. I put three ‘S’ on purpose to show you that there are multiple performance targets you must consider.
It’s frame-rate, yes, but we also care about loading times, memory budget, package size and all these little things that player notice and review your project for.
After that, you iterate over the P3 Optimization Loop. Each time you iterate over this loop, this framework will give you a substantial performance boost and you’ll get closer to your performance goals.

Here’s how the P3 Optimization Loop works:
Profile: here, it’s all about gathering intel about your bottleneck(s) to help you craft your optimization options. This includes profiling tools like RenderDoc or VR, Matrix, unity profiler, PIX, VTune, etc.
Plan: investigate and weigh at 3+ options to combat this bottleneck according to 4 metrics related to cost and gains.
Perform: execute the winning performance optimization tactic. The tactic that fits the 4 metrics best.
After you repeat several iterations of the P3 Optimization Loop, you end at your target performance goals. There’s no other way.
And after that, you do a P3 Performance Retrospective to learn from previous mistakes and avoid them by teaching your colleagues. Here, you would create your do’s and don’ts lists.
Now, this is a very simplified view. Each of these steps has sub-steps that I can’t fully disclose (the P3 Optimization Framework is a paid product).
If you want to learn more about the P3 Optimization Framework, the step-by-step optimization process that optimizes your project from zero to X, check https://p3framework.thegamedev.guru/.
But let’s cut to the chase. Let’s see how to apply this framework* to a bottleneck.
* Remember: this is just a simplified version of the P3 Optimization Framework.
Example: P3 Optimization Loop
Alright, let’s give a quick optimization pass to the 3D Beginner project by Unity.
Obviously, this is not a project that was intended for VR, let alone mobile. So we can expect it not to perform that well.
Where should we start? You know, just deploy to Quest and let’s see how it goes.
Alright, let’s see how this looks like...
This is nice, 72 FPS while looking at a wall.
But if I turn around, we are down to 20 FPS. Not great, feeling rather dizzy already.

The frame-rate and other performance numbers you see above are coming from OVR Metrics, by the way :)
So the first step in the P3 Optimization Framework is to define your performance goals. In our case it is quest 2, so we’ll stick to 72 FPS.
Obviously we are not there yet, so we will execute an iteration on the P3 Optimization Loop:
Profile
Plan
Perform
Let’s start with the Profile phase.
1. Profile
We are like very far away from our 72 FPS goal.
So I wonder what is going on in the scene?
So the first thing we are going to do is to profile and see what is happening.
How do we do this? With tools.
We have over 10 tools that we could use to see what is going on. But two of my favorite ones are the Unity Profiler and OVR metrics, and we might as well need to use the Frame Debugger.
So for this you have to press CTRL/cmd + 7.
Then you need to attach to the player to your Quest device.
Make sure that you’re recording on the profiler and put the headset on again. Don’t forget to close your eyes so the 20 FPS don’t hurt your brain.
As soon as I turn around to see the main contents of the scene, the frame-rate drops dramatically.
So what does the profiler say about these numbers?
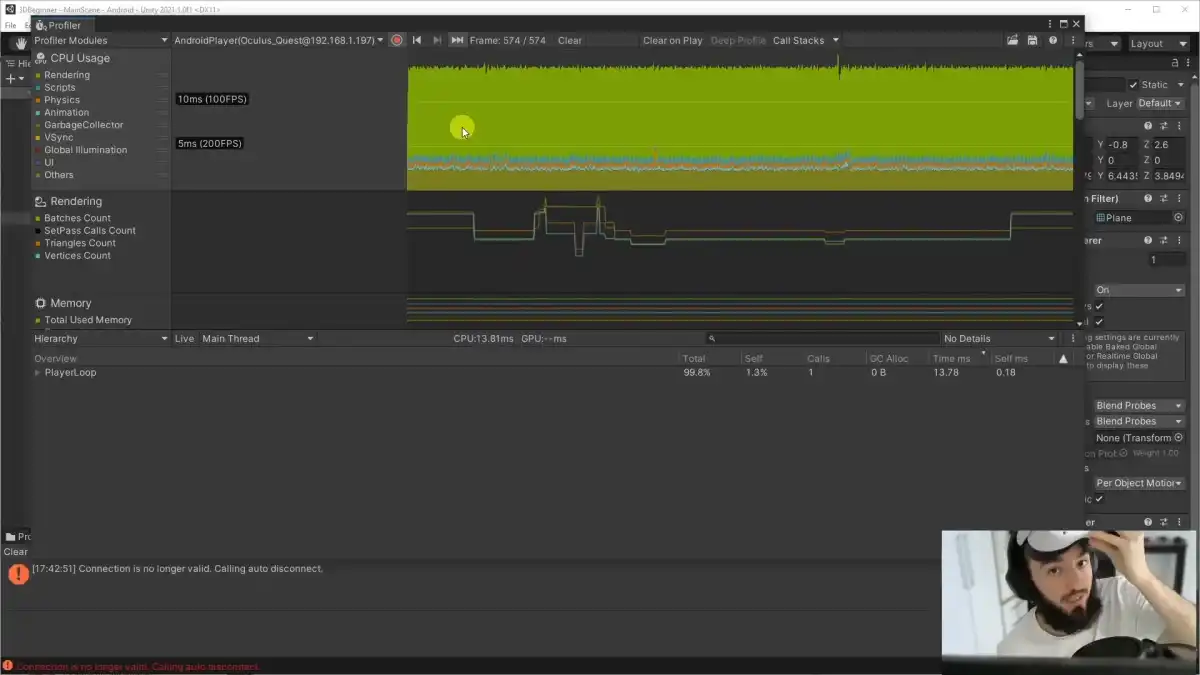
Let’s check the timeline to see what the CPU is doing.
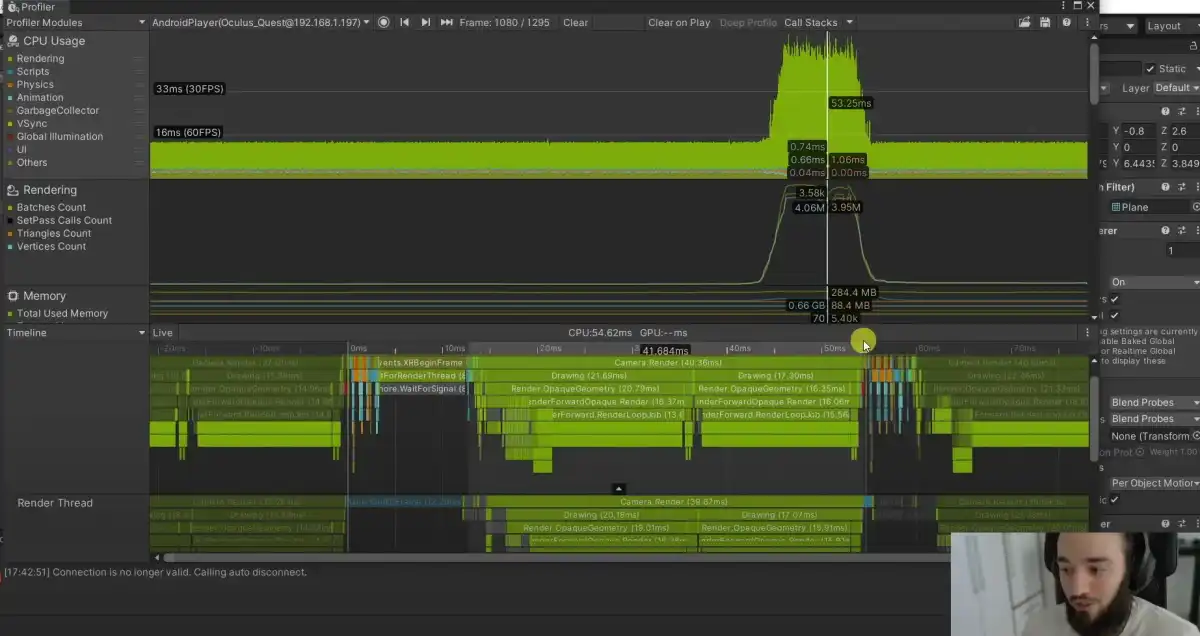
OK, so basically we have our main thread and are spending about 40 ms in rendering; definitely too much time spent on rendering.
If you are targeting Quest, you want to be below 6 ms in rendering. So 40 is definitely not good.
You have to ask yourself: where is this rendering bottleneck coming from?
We are talking here about the CPU, right? And the CPU seems to be VERY busy doing something...
Doing what, exactly?
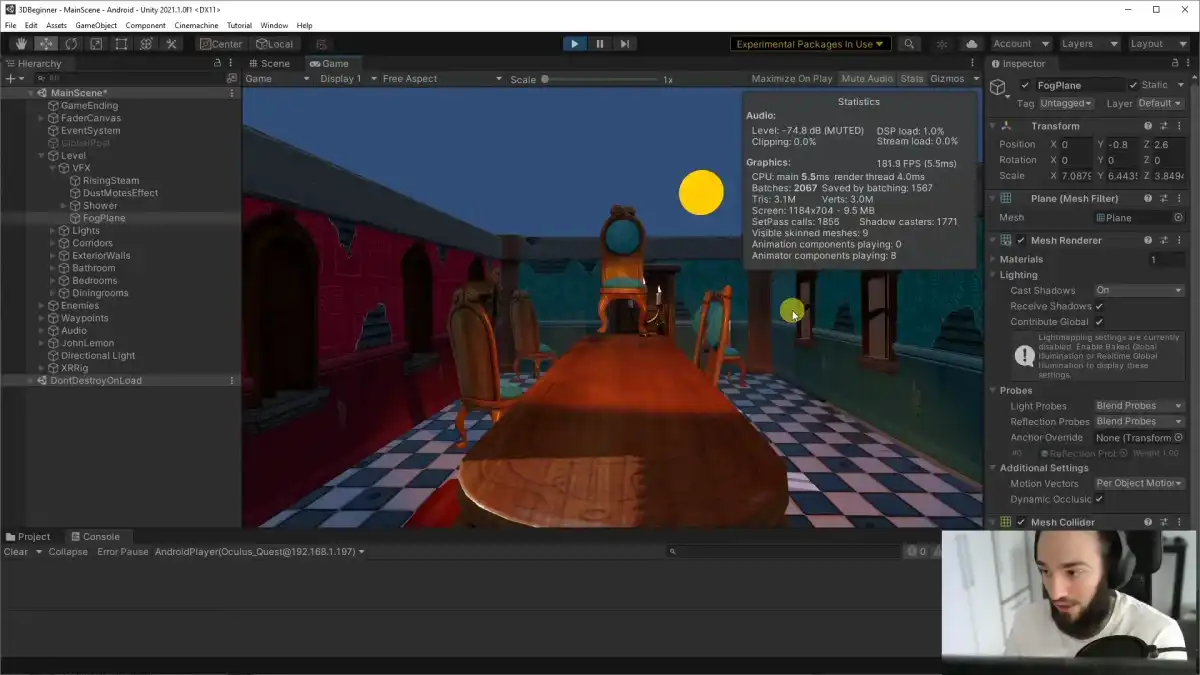
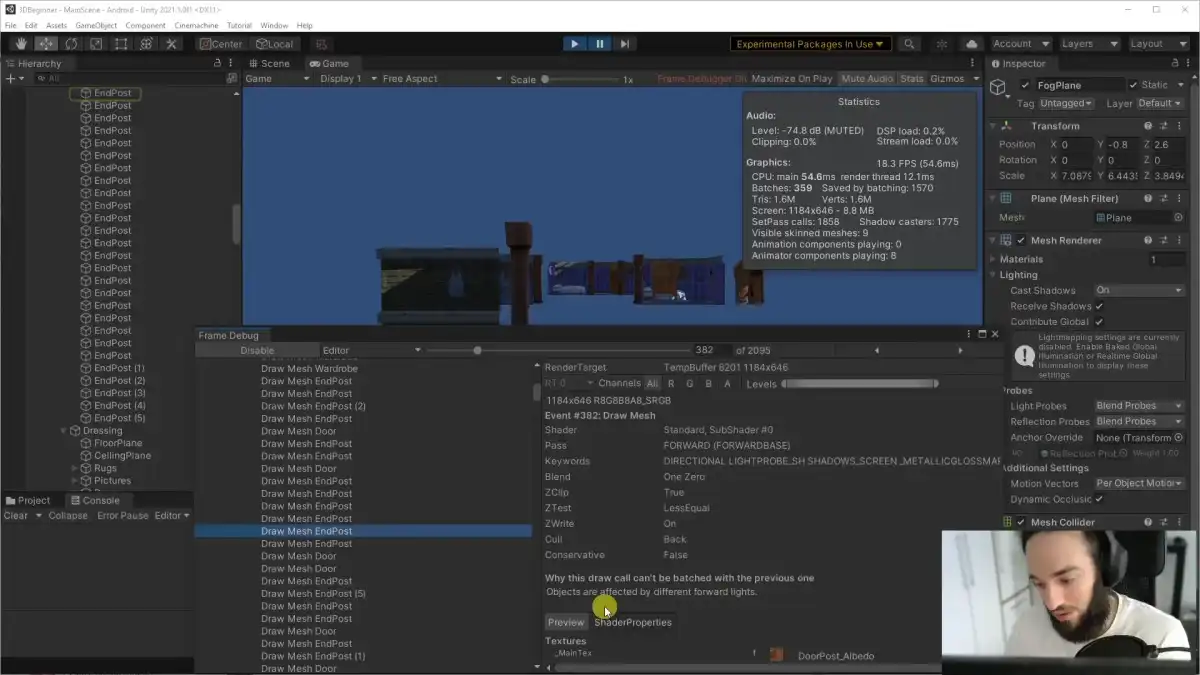
Let’s check more numbers, now in the stats panel.
About 2000 batches, 3 million triangles, etc..

If you have previous experience developing for Quest, you will instantly know that we are way above our budget regarding batches and triangles count. Btw, batches is just another word for draw calls. And draw calls are the way your CPU has... to tell the GPU to render something.
So basically we are just rendering too many objects.
This number that you see here, 2000, is above our budget of 200 for Quest. This explains why if you go to the profiler, you will see that we are spending way too many milliseconds on the rendering section.
Next question: why do we have so many draw calls and what can we do about that?
Remember, we are still in a profile phase, so we are just gathering intel. We are just gathering information that will let us decide later on.
To analyze draw calls or batches we need to open the Frame Debugger.
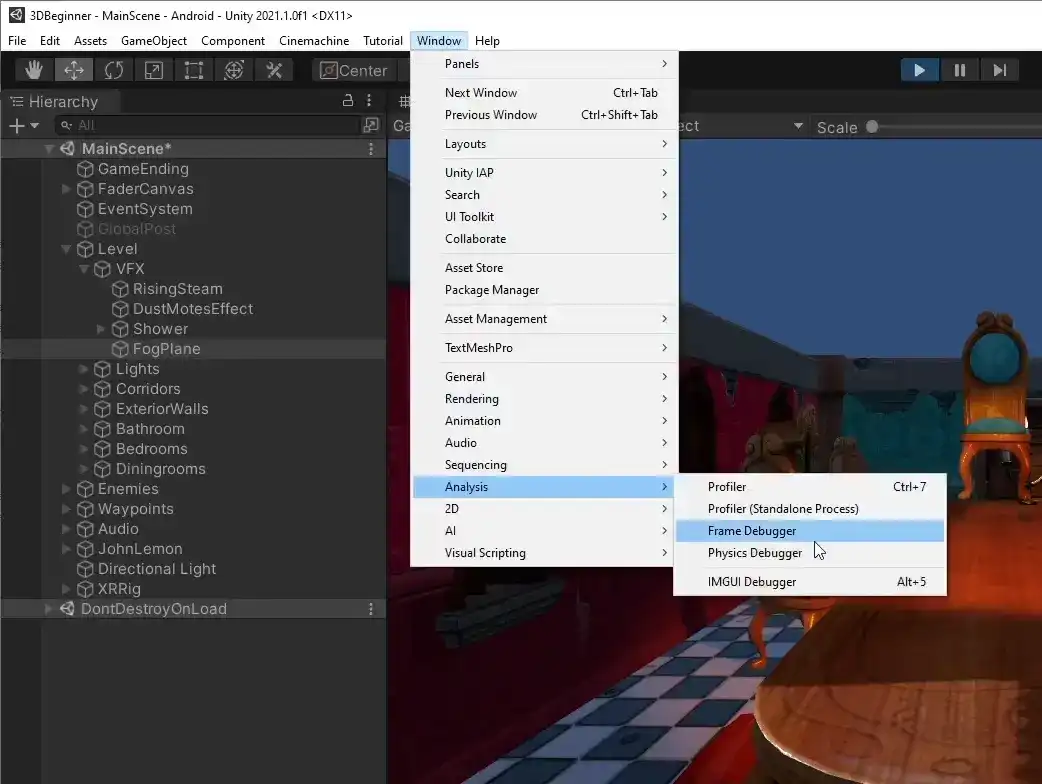
OK, so here you can just click enable and go to the game tab.
By the way, don’t do this attached to Quest for now, just do this on the editor. It is not going to be 1:1 the same, but this is going to be much faster.
Yes, you can do it on your target device for maximum accuracy, but for a first and brief look, you don’t need that.
So here we are going to see the composition of our draw calls.
We see that most of our draw calls are coming from the opaque geometry. And here we see that 300 of these draw calls are coming from shadows. So that’s very good intel to write down. Yes, you need to document your findings in the profile face.
So 1700 draw calls are happening here in the opaque rendering section. And if we have a look at the detail of these draw calls, you will see the reasons Unity could not batch these draw calls.
As you inspect these draw calls, you will see that Unity can’t batch these draw calls because these objects are affected by different forward lights.
Is that the case?
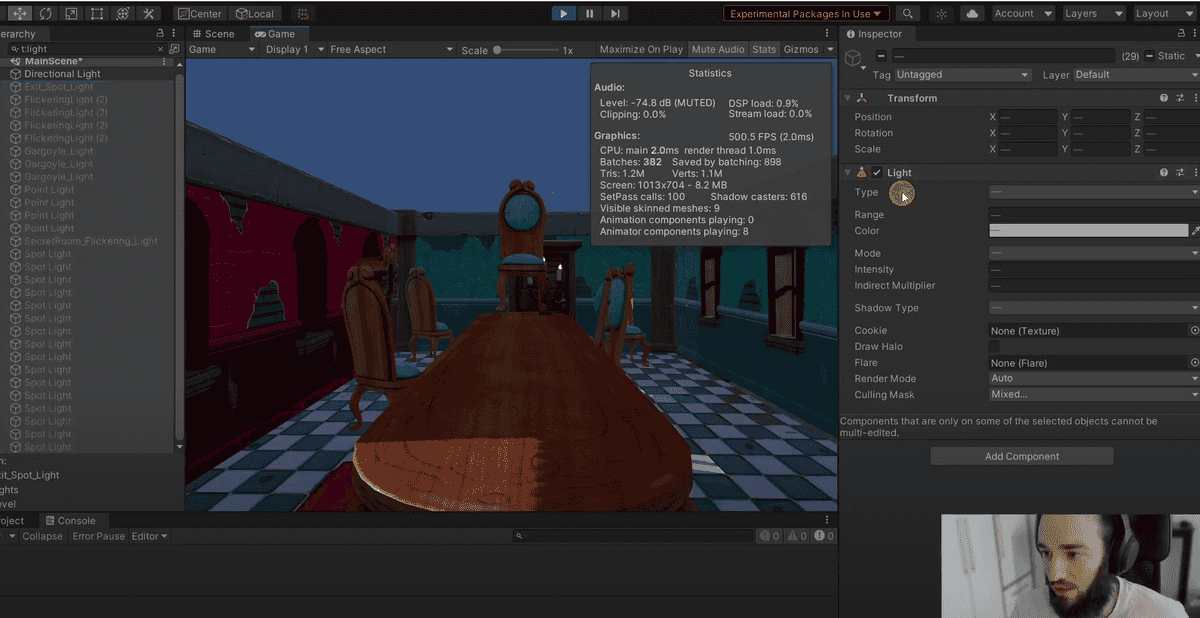
Just type t:light in the scene hierarchy and indeed you see we have too many real-time lights in the scene.
Are you surprised why this is running at 20 FPS? Sure it looks good, but if it runs at 20 FPS, I’m not going to care about how it looks. I’m just going to probably spend a few hours puking and shaking.
So anyway, what can we do about this?
If it says that we have way too many lights, the obvious thing we can do is to remove some lights.
That’s one option. OK. And by thinking about options, we already advanced to the plan stage.
2. Plan
A) Remove lights
So option number one, remove lights. So one example could be to select these lights and disable them during play mode to see its effect.
If we do this, you’ll see that the number of batches dropped to 400. A really juicy improvement.
OK, so that’s one option. And most devs will just go for this option and call it a day. Remove lights, go home and be proud about that.
BUT if you do this, however, you will see a huge decrease in quality, right?
Just compare the visual difference here, it is pretty significant.
So think of more options. Remember, in the plan stage, we always want to think about three or more options. Otherwise you risk going for the cheapest option for the developer (usually the worst for the user).
Here’s another:
B) Baking Lightmaps
OK, so the second option would be to bake to these lights so we don’t run these expensive calculations in real-time that are killing draw call batching.
We do this by setting the light mode of our lights to Baked.
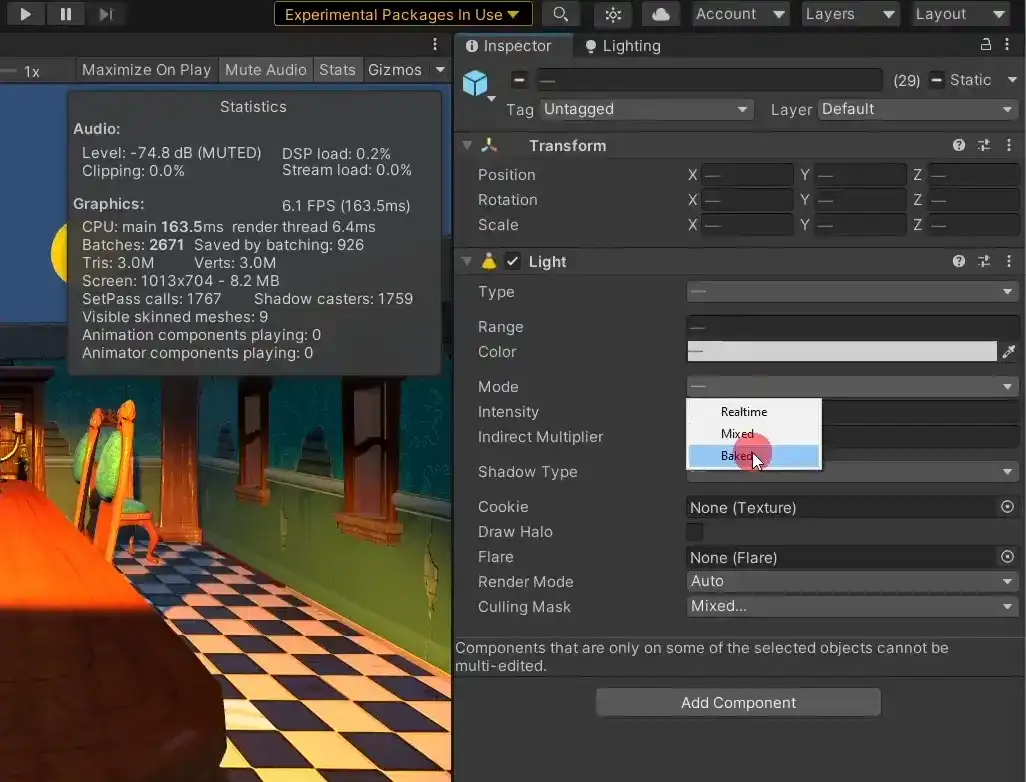
Let’s select for now something like subtractive lighting mode and then click on generate lighting.
I, by the way, reduce the lightmap resolution to 4 texels per unit to iterate faster; you can always increase this later.
After doing this we get 400 batches. Amazing for the first P3 Optimization Loop.
And this looks way better than first option, which was to remove the lights.
Problem? We lose some juicy effects. For example, the dynamic flickering of the light is gone :(
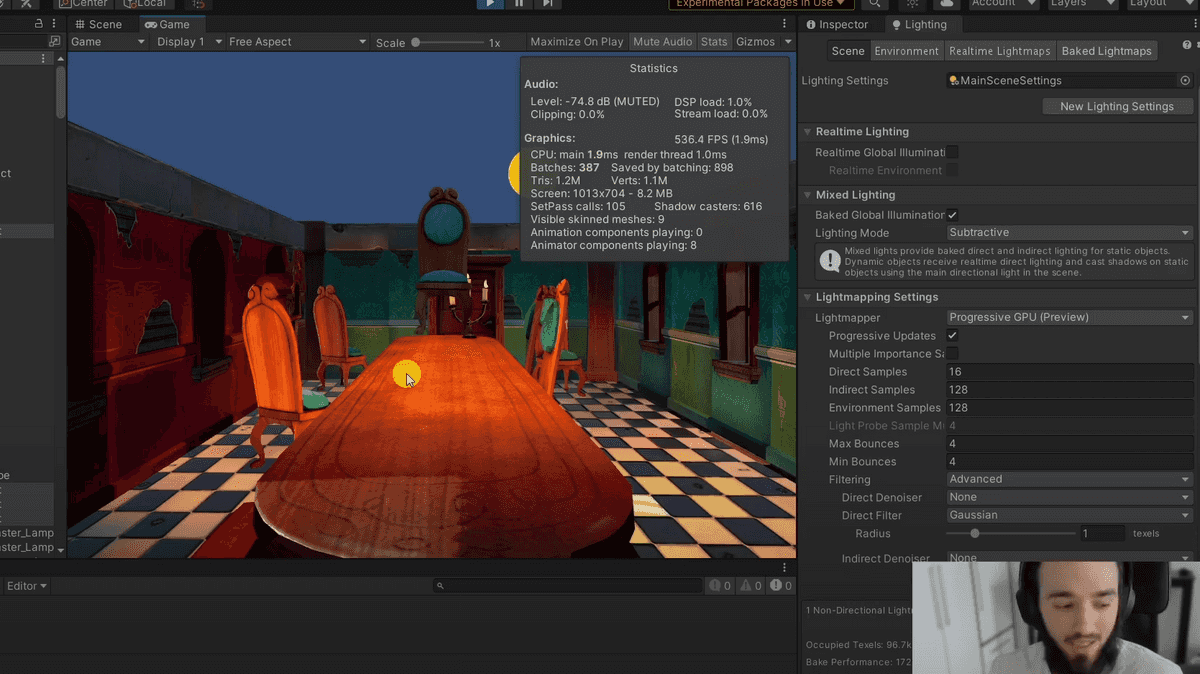
In any case, this is still a better option, so you could totally go for this after tweaking the lightmap baking parameters.
However, we said that we want to at least consider 3+ options.
What else could we do?
Now, if you have some experience in game performance optimization, you will instantly recognize something if you navigate through the scene... it’s quite much indoors.
And what techniques can we apply when we are in indoors scenes to reduce draw calls?
Correct!
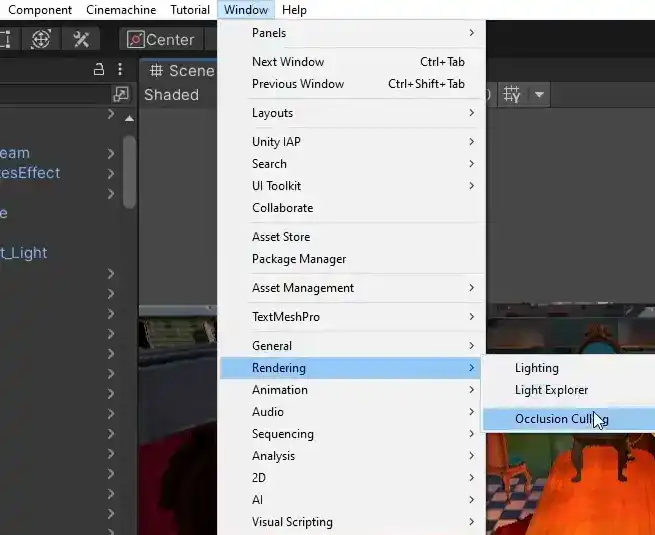
C) Occlusion Culling
Occlusion culling is all about NOT rendering objects covered or occluded by other objects.
So if we are looking at an opaque wall, no need to render anything that is behind it.
Let’s give this third option a try through super-fast testing.
Go to window, rendering, occlusion culling.
Don’t worry about the baking parameters for now, just pick something that’s good enough for experimenting.
Now that we baked occlusion culling, the camera preview will stop rendering these elements that are not visible to it. Exactly what we wanted.
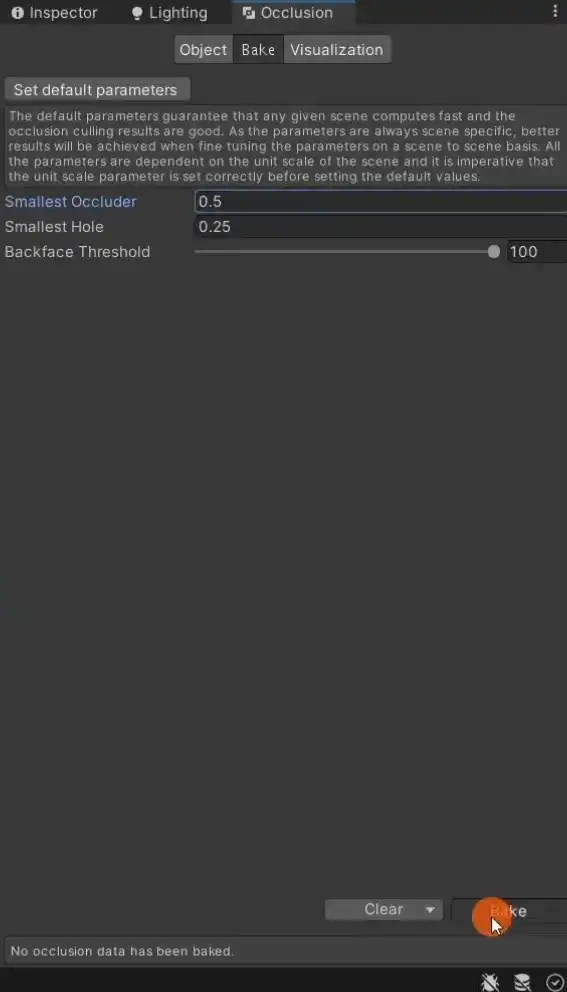
We can disable that visualization by just switching to another tab of the occlusion culling window, like bake.
We can get pretty juicy gains of occlusion culling it seems. We were at 2000 batches... and now we are at about 200.
It is quite similar to what we had before by removing the real time lights and even by baking lightmaps. But this option looks much better!

We’re talking about this room, of course. If we go to another room, of course, we will need to do some other types of optimization. But step by step, we don’t want to optimize everything at once.
At TheGamedev.Guru we do small P3 Optimization Loops that lead to big gains.
So now that we have played with three options, let’s make a build and see if this would get us a good performance jump.
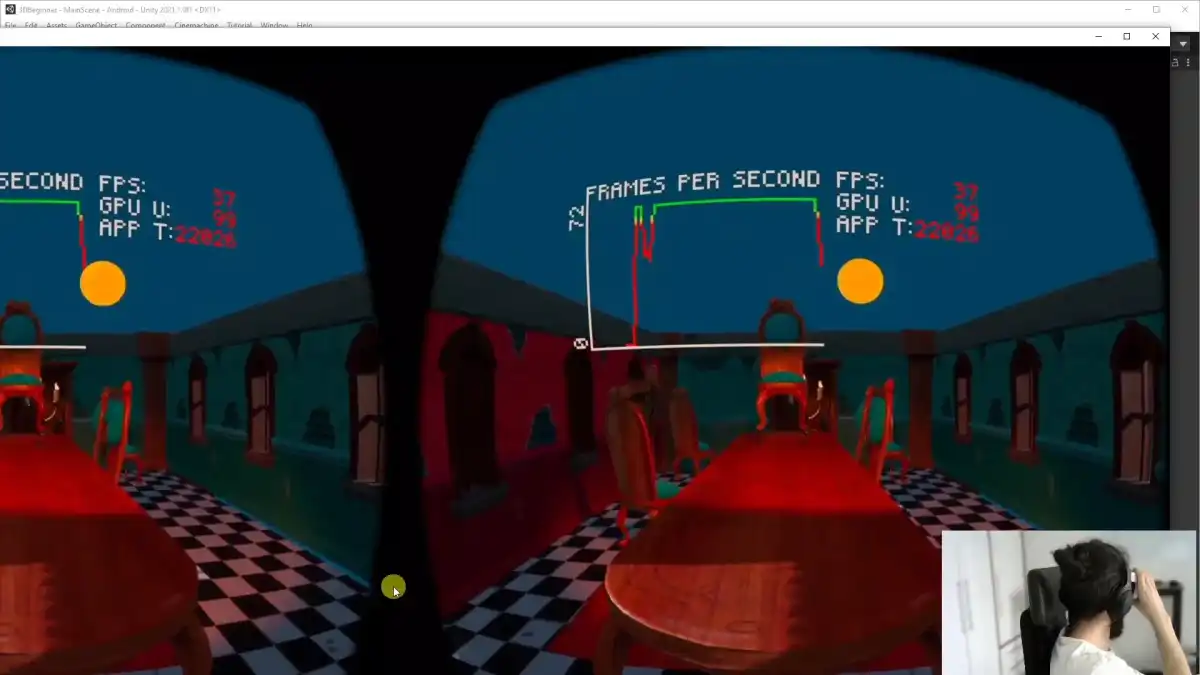
We just jumped from 20 to 37 FPS in our first P3 Optimization Loop.
Juuuuuicy!

So what you have discovered right now in the planning phase after some investigation is that you have three alternatives.
Removing lights: really detrimental to the player
Baking lights: slightly detrimental to the player (missing dynamic lighting effects)
Occlusion culling: invisible to the player
A promising P3 Optimization Loop.
3. Perform
Now it will be the time to go to the perform stage, the last step of the P3 Optimization Loop.
Here, we just need to find the right baking parameters for the occlusion culling to do it properly.
Once you do it, test it and submit your changes to perforce, git, svn, ftp, whatever it is. And then call it a day.
Since we are not at 72 FPS yet, we would need to execute more P3 Optimization Loops. And those will lead to new intel, options and optimizations until you reach your performance goal.
But what’s your performance goal?

It could be 72 FPS if you’re targeting Quest, but it could also be 120 FPS because Oculus supports it now.
With such a small budget, performance optimization is now more important than ever, especially in the area of rendering.
Can you imagine how well your application or game would sell if people knew it is one of the few that natively support 120FPS? A good unique selling proposition.
As you might imagine, reaching 120 FPS is complicated.

But it becomes easier if you follow a step-by-step framework like the P3 Optimization Framework.
Just by following a solid optimization process that brings you from zero to hero.
Which brings me to...
![]()
Unity Performance Taskforce
If you liked this post, there is something much better waiting for you: The Unity Performance Taskforce.
Here I show you the real good stuff: strategies and tactics that save you months of painful optimization work.
In this membership, you get one video each week focused on one of the four performance pillars:
In the first week of the month, you get is a lesson on professional performance. Here, it’s all about making you a high performing developer.
The second week is all about making your CPU run more efficiently: physics, AI, gameplay, interaction, rendering and everything alike.
In the third week, you get a lesson on GPU optimization. Here, you make better graphics cost less.
In the fourth week, you receive a lesson on memory performance; reduce your memory usage, memory bandwidth, package size, loading times and alike.
The best part: you gain access to a live lesson per month so you can to ask your questions and connect with other high performing Unity developers.
So if you would like to stay up to date in the games industry, check out my Unity Performance Taskforce.
Ruben (The Gamedev Guru)
Read more about:
Featured BlogsAbout the Author(s)
You May Also Like


.jpeg?width=700&auto=webp&quality=80&disable=upscale)


