Analysis: As U.S. Console Retail Declines, Where Now For The Game Biz?
Gamasutra analyst Matt Matthews examines reasons for 2010's U.S. retail video game industry declines -- including a handheld market "under assault" from mobiles -- and how non-retail markets affect 2011.

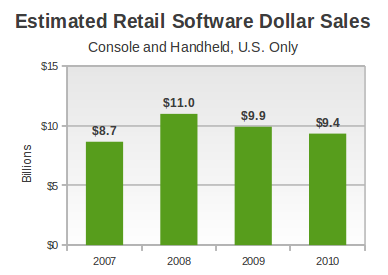
[As part of an in-depth NPD analysis for December and all of 2010, Gamasutra analyst Matt Matthews examines reasons for 2010's U.S. retail video game industry declines and how non-retail markets will play into 2011.] According to the NPD Group estimates for all of 2010, the retail software market shrank again for the second year in a row. In 2008, consumers spent $11 billion at retail on console and handheld software. The following year that spending fell 10 percent, to $9.9 billion, and then in 2010 it fell by a further 5 percent, to $9.4 billion. There are many possible explanations. According to Wedbush analyst Michael Pachter, the music game genre declined to below $300 million for all of 2010, after reaching approximately $900 million in 2009 and nearly $1.7 billion in 2008. Wii Fit was also another big-ticket item classified as software during that same period, and its sales have declined and dropped in value as consumers who already own Wii Balance Boards opt to upgrade to the software-only version of Wii Fit Plus. At the same time, the traditional handheld software market has been under assault from many pressures, including competition from devices like the iPhone and iPod Touch which offer cheap or free games through Apple's App Store. In each of 2007 and 2008 the Nintendo DS and PSP software market was worth around $2 billion annually. According to Doug Creutz of Cowen and Company, that market's retail value dropped by 10 percent in 2009, and then dropped another 24 percent in the past year. While it is tempting to ascribe much of that decline to the implosion of the PSP market, we still note that the Nintendo DS generated 20 percent less revenue in 2010 than it did in 2009, even as its installed base increased in size by more than 20 percent. Even the decline of the PlayStation 2 has played a part: we estimate that PS2 software revenue dropped by 50 percent from 2008 to 2010, a loss of about $200-$250 million. And then there is the ongoing recession in the United States which started in December 2007, according to the National Bureau of Economic Research. It stands to reason that consumers suffering through unemployment or foreclosure are far less likely to spend money on leisure items like video games. How bad is the current decline? It's enough that the term “persistent secular decline” seems more appropriate each month. (The term was notably used by Wedbush's Pachter to describe investor perception of video game market contraction.) While analysts have speculated that software could rebound in 2011 (e.g. “low double digit” growth according to Pachter, +3 percent according to Cowen and Company's Creutz), that growth is still relative to the weak results posted in 2010. Even at 12 percent growth, the retail software figure for 2011 would still fall short of the $11 billion mark set in 2008. Here is the current decline in an easy to visualize form. The first figure shows how total software revenue has changed since 2007.  While the installed base of current generation has expanded from about 20 million consoles and 28 million handhelds at the beginning of 2008 to 75 million consoles and 65 million handhelds at the end of 2010, the total revenue being generated by those platforms has declined by about $1.6 billion. During that same period, we can look at software unit sales and see a similar decline.
  The striking point about this view of software sales is that the volume of software sold at retail has essentially returned to the level seen in 2007 – the first full year that the PS3 and Wii were on sale. We should note that it isn't that the current generation hardware systems aren't increasing their software sales. In fact, they are, as the figure below shows.
  According to Pachter, the current generation consoles – Xbox 360, Wii, and PS3 – collectively increased their software unit sales by nearly 8 percent. While the Wii did decline (from over 70 million to 65 million units), the growth in the PS3 and Xbox 360 markets more than compensated for that decline. Software revenue also increased on those platforms in 2010, albeit by a much more modest 3 percent. Stepping back a bit, this means that growth in the current generation console market has not made up for greater declines elsewhere – in handhelds and the old PS2 market. The Broader Market Slowly Comes Into Focus Those consumers haven't disappeared, and we consider it unlikely that people have en masse turned away from video games. Rather, we believe that consumers are finding their gaming in other areas. The NPD Group has attempted to measure the money spent by consumers in these other areas, as part of their Games Industry: Total Consumer Spend (2010) report, the full version of which is due out in March 2011. The figures that the NPD Group has released so far regarding 2010 provide at least one measure of where the money is going. Here is what they have said: - Consumers spent $6.3-6.6 billion in the first half of 2010 on new physical games, used games, game rentals, subscriptions, digital full-game downloads, social network games, downloadable content, and mobile game apps. - Consumers spent approximately $15.4-15.6 billion in all 2010 on those same types of content. - That annual figure reflects a flat to 1 percent decline over the same measure for 2009. Taking into account the known physical retail game sales figures (again from the NPD Group), we arrive at a few conclusions. First, consumers spent approximately $5.3-5.5 billion on content outside of new physical games in all of 2010. That represents 33-36 percent of the full video game content market. Second, we can estimate that consumers spent between $4.9-5.1 billion outside of new physical games in all of 2009, or roughly 31-33 percent of the full video game content market. Those figures show that the extra-retail market is growing, but modestly. The annual rate is around 4-12 percent. If the extra-retail market continues to grow at a rate in this range through 2011, we can expect that that segment of the market will reach $5.5-6.2 billion. However, there are also some parts of the NPD Group's data that make us skeptical. Specifically, if the total extra-retail market was worth $2.6-2.9 billion during the first half and only $5.3-5.5 billion for the full year, then these other areas of consumer spending don't appear to be nearly as affected by seasonality as the new physical game market is. While it is possible that the extra-retail market that the NPD Group is attempting to measure is dominated by some forces that are not seasonal (e.g. social network games need not generate more revenue at Christmas than during the spring season), the data provided so far does not suggest as much. For the sake of comparison, the new physical game market is heavily seasonal. According to 2010 figures, new physical software sales generated $3.5 billion during the first half of the year and $5.9 billion during the second half, an increase of nearly 70 percent. There is one other point worth noting. When the NPD Group released its first estimates of extra-retail spending for 2009, it specifically left out social network games and cited a total market value of $15.0-15.25 billion. Given the differential between this result and its revised result, one arrives at the suggestion that social network games were worth about $250-350 million in 2009. It is possible that these estimates provided by the NPD Group are the very best currently available. However, the value of social games and the non-seasonality of the revenue streams give us pause. Therefore, we again renew our call for more transparency from publishers and platform holders, either independently or in conjunction with a third party like the NPD Group. They alone can provide substantial data on unit sales and revenue in areas like Xbox Live, the PlayStation Network, Steam, and even Facebook. For the rest of Matthews' monthly NPD analysis, read the full Gamasutra feature, available now.
About the Author(s)
You May Also Like


