Trending
Opinion: How will Project 2025 impact game developers?
The Heritage Foundation's manifesto for the possible next administration could do great harm to many, including large portions of the game development community.
In this article taken from Game Developer magazine's September 2010 issue, Google game developer advocate Chris Pruett describes how he quickly and cheaply implemented useful metrics into his Android game, Replica Island.

[In this article taken from Game Developer magazine's September 2010 issue, Google game developer advocate Chris Pruett describes how he quickly and cheaply implemented useful metrics into his Android game, Replica Island.]
There's nothing like watching somebody else play your game. Over the course of development, you've played the game daily, and have, perhaps unconsciously, developed a particular play style. But putting your work into the hands of a novice gives you a chance to see what happens to your design when it's played without the benefit of daily practice.
Every collision pop, animation snap, confusing tutorial message, and intermittent bug seems amplified when a beginner plays. No matter how much you polish or how many bugs you fix, your play style and intimate familiarity with the content can bias you away from problems that other users will immediately encounter.
That is why playtesting is a vital part of making a good game. In order to truly get the most from playtesting, you're going to have to take some data from these sessions -- this article chronicles my experience with gathering gameplay metrics.
I got my start in the industry writing Game Boy Advance games. Back then, our idea of playtesting was pretty straightforward: we would get some local kids to come in, hand them a special GBA that was hooked up to a VCR, let them play for a bit, and then go back and review the tapes. This procedure yielded immediate, dramatic bugs.
Areas that the team took for granted were often sources of tremendous frustration for our testers. When a member of the target audience fails continuously in a specific area, it is usually a clear message that something needs to be fixed. A couple iterations with real live kids and the side-scrollers we were making would be vastly improved.
Nowadays, I work on and advocate games for Android phones. My first Android game, Replica Island, is a side-scroller, not so different from the GBA games I was making 10 years ago. But some things have changed: I'm no longer working for a game studio; I wrote Replica Island on my own, with the help of a single artist, mostly on my free time.
I also no longer have access to a pool of young playtesters, and even if I did, my target audience is a bit older. Finally, there's no easy way to record the output of a phone while somebody is playing -- the only way to really see what's going on is to stand over their shoulder, which is awkward and can influence the way the tester plays.
What is an indie phone game developer to do? As I reached feature completeness for Replica Island, I realized that I really had no way to guarantee that it was any fun. The game had been developed in a vacuum, and I needed to get more eyes on it before I could feel confident releasing it.
The first thing I tried was user surveys. I put the game up on an internal page at work and sent out an email asking folks to play it and give me feedback. I even set up a feedback forum with a few questions about the game.
This approach was pretty much a complete failure; though many people downloaded the game, very few (less than 1 percent) bothered to fill out my five question survey. Those who did fill out the survey often didn't provide enough information; it's pretty hard to tell if "game is too hard" indicates a failure in the player controls, or the level design, or the puzzle design, or the tutorial levels, or what.
After that setback, I remembered reading about the player metrics system Naughty Dog developed for the original Crash Bandicoot. The system wrote statistics about play to the memory card, which could then be aggregated offline to find areas that took too long or had a high number of player deaths.
These problematic areas were reworked, and the data was also used to tune the dynamic difficulty adjustment system in that game. One of the most interesting principles that fed into the design of this system was Naughty Dog's idea that the game over screen must be avoided at all costs. Their end goal was to remove "shelf moments," moments in which the player got stuck and could not continue.
I thought this was a pretty cool idea, but I wasn't sure how feasible it would be on a phone. I asked around a bit to see what the current state of metrics recording is on big-budget games, and found that many companies have some way to report statistics about player actions. Several people told me that while they collect a lot of information, they have trouble parsing that data into results that suggest specific design changes.
On the other hand, some studios have tools that can recreate a player's path through a level, and produce statistics about which weapons users prefer, which enemies are particularly tough, and which parts of the map are particularly visible. It seems that collection of player metrics is applicable to a wide variety of games, but that it only benefits the studios who also take significant time to build tools to crunch all the data that they collect.
(For an example of how this kind of system can be taken to the extreme, see Georg Zoeller's talk about the crazy system they have at BioWare.) It turns out that collecting the data is the easy part -- rendering it in a way that is useful for designers is much harder.
That sounded discouraging, as my goal was to keep my tool chain as simple as possible. But I decided to experiment with some metrics recording anyway, starting with just a few key metrics. My Android phone didn't have a memory card, but it did have a persistent internet connection. Maybe, I thought, I could log a few important events, send them to a server, and get results from players that way. My goal was to try to understand as much as possible about my players while keeping the system as simple as possible.
The event logging system that I wrote has three parts: a thread in the game runtime that collects player events and sends them to a server; the server itself; and finally a tool to parse the data recorded by the server.
"Server" is a strong word in that second component. My server is actually a PHP script that, in about 30 lines of code, validates the HTTP Get query it is sent and writes the results to a MySQL database. The query itself is dead-simple: it's just an event name, level name, xy location, version code, session id, and time stamp. These fields are recorded to the database verbatim. The actual processing of the data is also done in PHP (a poor choice, in the long run; more on that later), though only on demand when a special dashboard page is loaded.
I started with just two events: player death and level completion. Each time a player dies or completes a level, the game reports that event to the server. From this data, I was able to construct a pretty detailed overview of the game flow. I could see which levels took the longest, which had the most deaths, and which were unusually short.
By dividing my values by the number of unique players, I could also see what percentage of players died on certain levels, and the average number of deaths for each player.
By looking at the spatial location of the event, I could tell the difference between a death from an enemy and a death from a pit. As a first-pass implementation, my simple metrics system proved to be pretty detailed.
Once I had the basic reporting system up and running, I released an update to my testers and watched the data flow in. Very quickly, patterns emerged; there were some levels where almost 100 percent of players died at least once, and other levels in which players were getting stuck for hours (indicating a pretty major failure for a level designed to take five minutes). Just by looking at the numbers, I had a clear picture of which levels needed the most work.
But identifying problematic levels wasn't enough. Sometimes I couldn't tell why a particular level was a problem.
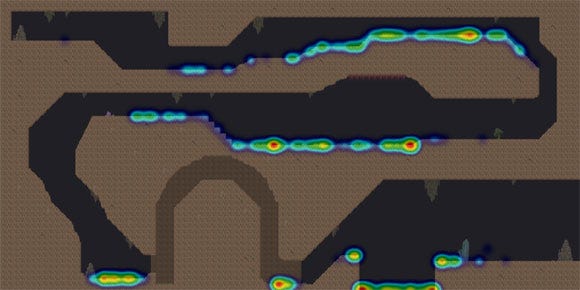
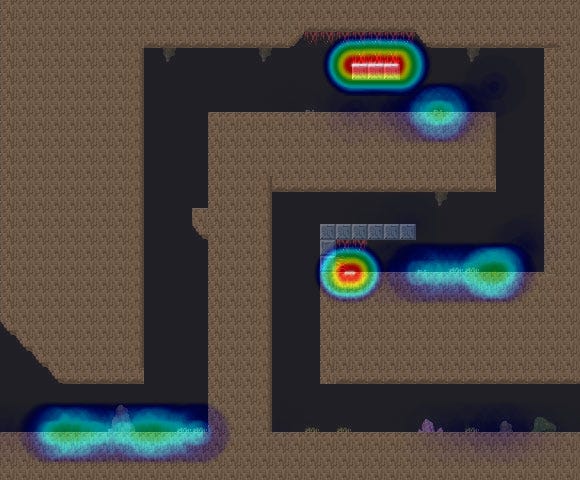
So I went a step further. Using the same data, I wrote a tool to plot the death positions on top of the level art so that I could see exactly where users were dying (and where they were not). The first pass of this system just drew a little dot on the level art when a player died, but once the number of players grew to be large, I switched to rendering heat maps of death locations over the levels, which was much easier to read (see "How to Make Heat Maps," at the end of this feature).
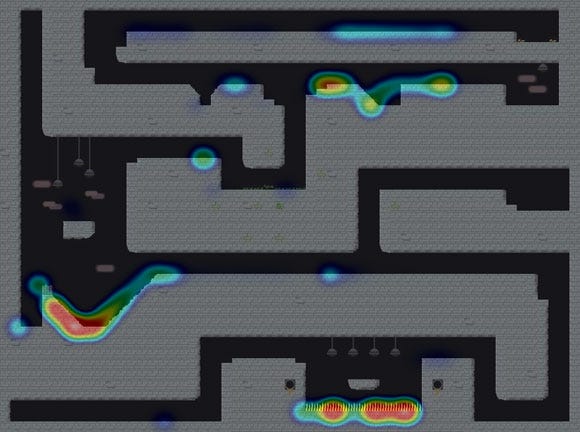
Heat map generated from player death statistics in Replica Island (click for full size).
The combination of high-level play statistics and plotted death locations was illuminating. I learned, for example, that a huge number of players were dying at the very first enemy. This was not because the enemy was particularly hard; after considering the problem, I realized it was because the enemy appeared in a spot where the main attack -- a crushing butt stomp, performed from the air -- was difficult to accomplish due to a low ceiling.
I also learned that my simple dynamic difficulty adjustment system needed adjusting itself. This system secretly increases the player's life and flight power after a certain number of consecutive deaths, and by looking at the data, I could see that it needed to kick in a lot earlier.
I also made sweeping changes to my level geometry. I had a few levels with very high completion times but very few deaths, and I realized that players were simply getting lost. I reworked these levels to make the paths through them clearer; in one or two cases, I scrapped an entire level and made a new one from scratch.
But the biggest problem that I identified was with pits. Replica Island is a platformer, and as you can guess, it involves a lot of jumping over pits. But unlike certain spinning marsupials and pipe-dwelling plumbers, my character's main mode of transport is flight.
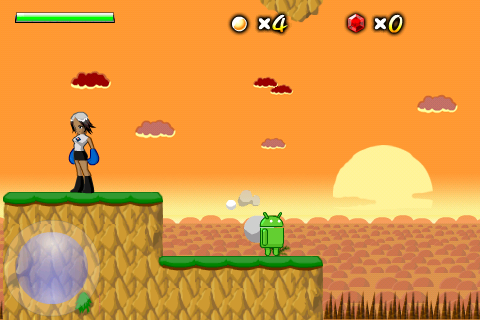
I needed a control system that did not require a D-pad, so the protagonist in Replica Island, the green Android robot, flies using rocket thrusters on his feet. The basic movement model involves getting momentum up while on the ground before jumping into the air and using that momentum, along with the thrusters, to fly around. The thrusters run out of juice quickly but refill when you land, so the idea is that a player will jump into the air and then carefully expend his fuel to reach distant ledges or line up a precision butt stomp.
All that is well and good, but when I looked at the death data coming back from my playtesters I found that they were dying in bottomless pits en masse. Droves of players were falling down even the smallest of holes. And of even greater concern, the death-by-pits numbers did not decrease over the course of the game; players were not getting better at making jumps as time went on.
With this information in hand, I reviewed my core game and level design and came up with a number of theories. The basic problem, I decided, was that players could not see the pits they were jumping over. First of all, there was no visual indication that a pit of death is a pit of death; since my levels are often very tall, it's hard to tell which pits lead to some underground level segment and which lead to a grisly demise.
Second, and most important, my camera was not doing a good enough job of keeping the floor visible when the player jumped into the air. Almost as soon as the player leaps into the air the ground would scroll off the bottom of the screen, making it hard to judge where to land.
Master platformers like Super Mario Bros. almost never scroll vertically; Mario has a whole set of complicated rules dictating which specific circumstances allow the camera to move up and down. In Replica Island, however, the flight mechanic meant that I had to allow vertical scrolling in the general case. After a bunch of tweaking, I came up with a smarter camera that does not begin to scroll vertically unless the player is close to leaving the visible space themselves.
After making these changes, I shipped another update to my beta testers and compared the results to the previous version. The deltas were very reassuring; deaths were down overall, level completion times were, for the most part, back into normal ranges, and pit deaths dropped by a pretty huge margin. I iterated several more times with these testers before I was ready for release, but with the metrics reporting system in place, it was easy to see whether my changes were having an influence on how my testers were playing.
After several iterations with my test group, my graphs started to align to the bell curve I was looking for. It was time to ship the game, and I decided to leave the metrics system in place. I wondered if the data I collected from live users would look different from the data produced by my test group. There was only one way to find out.
Of course, any time an app reports data back to a server, it's best to let the user know about it. The first time Replica Island is launched, a welcome message appears that details the latest game improvements. That message also informs the user that anonymous, non-personal play data will be uploaded to a remote server in order to improve the game, and that players who do not wish to participate may turn the reporting system off in the options menu.
This approach seemed like the best solution: though the code is open source and anybody can look at the content of the data packet itself (and I ensured that nothing about the metrics data can be tied to any specific user or device), allowing users to opt-out gives them an opportunity to say "no thanks."
By comparing my Android Market installs with the number of unique users reporting in, it looks like less than 20 percent of my users chose to opt out of metrics disclosure.
As a result, I have a huge amount of data now -- over 14 million data points, close to a gigabyte of event information generated by my user base (which, as of this writing, is about 1.2 million players).
In fact, the volume of data broke my data processing tools pretty quickly; I have a snapshot of statistics from the first 13,000 players (which I have published on the Replica Island website), but after that, a lot of my tools failed. The good news is the first 13,000 players produced aggregate data that was very similar to the smaller test group, which probably means that the test group results can be applied to much larger groups of players.
I have been extremely satisfied with the event reporting system in Replica Island. For very little work, almost no cost (the server back end that records events costs less than an Xbox Live account), and using only two types of events, I was able to quickly and effectively identify areas where players were having trouble. Furthermore, once I started collecting this data, I was able to compare the aggregate result of my metrics between versions, which made it easier to see if my design changes were effective.
Using PHP and MySQL as my back end server language was a good choice; the actual recording of events is so trivial that I'm sure any language would have worked, but with PHP, the whole server took less than 30 minutes to put together.
Using a separate thread to report events from the game was a good move as well. I didn't want any sort of UI to block HTTP requests, and moving the web communication to a separate thread made sense, but I initially had some concerns about overhead. I needn't have worried; the overhead is so small, I can't even get it to show up in my profiler.
Finally, keeping the system as simple as possible was a really positive decision. I considered a lot of potential event candidates, but for my game, tracking player death and level completion provided more than enough information. More statistics would have complicated the processing of the data, and possibly made it harder to reduce the feedback to a concise view. Now that I've had some experience with automatic metrics reporting, I'll probably increase the volume of data that I send back in the future, but starting simple was definitely a good move.
Not everything about the event reporting system worked out well, however. I made a few decisions that ultimately turned out poorly, or just wasted time.
The decision to use PHP for the reporting server was a good one. It was a mistake, however, to use PHP to do the processing of the data. My idea had been to do everything via a web dashboard (I even wrote my level editor in PHP and Javascript), but PHP fell down hard when the amount of data I needed to manage exploded. PHP runs in pretty strict memory and speed requirements, and I found myself hacking around these limitations almost immediately. Once I passed 20,000 users, most of my PHP-based tools simply stopped working.
Bitmap processing was particularly painful in PHP. I did all of the heat map generation in PHP, but I should have just written something that could run locally instead of on a web server. I ran into a number of bugs in the PHP GD interface (compositing bitmaps with alpha is pretty broken), and ended up having to reduce the size of my level art images in order to do the processing.
For this article, I rewrote this tool using Python and ImageMagick, and the results are far superior. I've provided the code for this implementation, which can be found at the official Game Developer magazine website.
Finally, though this data tells me all about where players die and how long it takes them to complete levels, it doesn't help me identify shelf moments that are not related to death. I ended up shipping with a few key level design failures that my metrics never caught; in the most egregious case, players get stuck at a puzzle where they do not understand how to progress, and end up giving up before they complete the level.
This never shows up in my metrics because an event condition is never reached; I only learned about it when users started complaining about being stuck in the same spot. Automatic metrics are super-useful, but they can't show you a complete view of the game. In my case, the metrics were good at finding problematic level layouts but were particularly ineffective at identifying design failures related to rule communication.
For my next game, I'll definitely employ automatic metrics reporting again. In addition to death positions, I may add events based on different forms of death; it'd probably be useful to know how exactly a player died, not just where. And, depending on the game, it might be useful to report a history of positions before the death so that an individual player's path through a level can be traced.
However, the key to this kind of system is simplicity; collecting data isn't useful unless I also have reliable tools to process it later. For the next title, I'll probably leave the basic reporting and storing mechanism alone and focus most of my time on writing better tools for crunching the numbers.
I'm also wondering whether aggregated output from this form of player metric can be used to inform runtime dynamic difficulty systems.
If the game were capable of reading aggregated output back from a server, it could change itself based not only on the play of a single player, but on the average habits of millions of players. The availability of this data opens up all sorts of interesting possibilities.
Player metrics are not a perfect replacement for user testing, but they are a pretty useful approximation. And because they allow you to test a much larger group of users than would be possible with individual testers, metrics can tell you more about your game in the long run.
The cost to benefit ratio was extremely positive for Replica Island; by keeping the runtime and server dead simple, I learned much about my level designs and the habits of my players, and my game got a lot better as a result. My only regret is that I did not employ this kind of system on earlier games -- it seems applicable to pretty much any genre on pretty much any platform.
Generating heat maps isn't hard, but information on the exact procedure can be hard to find. I used a method similar to the one described here.
The basic procedure is as follows:
Prepare a grayscale image of a circle that goes from black in the center to transparent on the edges in a radial gradient. This is your event spot image.
Prepare a color gradient image. The bottom should be white, or red, or whatever color you choose to indicate "most intense" on the heat map. The top of the image should be black, and with several other colors in between. This image will be used as a lookup to colorize your output later.
Generate a list of event positions.
Calculate the maximum number of overlapping data points (i.e. the number of events that occurred at the most common xy position). This is the value of maximum heat.
For each unique location on the event list, draw the spot image to a canvas at the location of the event. Draw the image at ((number of events at this location) / (maximum heat) * 100%)) opacity. Use the multiply transfer mode (src * dest) to blend each spot to the canvas.
When finished, you should have an image with a bunch of black spots on it of varying shades of darkness. This is the intermediate output image.
Take the output image and remap its color table using the gradient image. Take the alpha value of each pixel and use it to look up a Y offset in the gradient image to find the color value for that pixel.
Take the resulting image and blend it over your level art. The event hotspots in the level will be shown as colored areas, with the intensity of color increasing in areas where more events occurred.
When doing this work, make sure that you keep your color space (particularly the opacity calculation in step 5) within regular 8-bits-per-channel ranges (or consider using a format that supports floating point pixels). It is easy to introduce precision bugs that will only manifest when there are so many data points that the contribution of a single event falls below 1 percent. Tools like ImageMagick can help you do this.
Read more about:
FeaturesYou May Also Like