

Daily news, dev blogs, and stories from Game Developer straight to your inbox
Sponsored By
Featured Blog | This community-written post highlights the best of what the game industry has to offer. Read more like it on the Game Developer Blogs or learn how to Submit Your Own Blog Post
Improving user acquisition effectiveness with big data Part 2 - Using excel solver to allocate UA budget
Applying past acquisition data to a linear optimizer lets you allocate your UA budget efficiently. We'll use the Excel solver linear optimizer to create the best allocation.
6 Min Read

This is part 2 of the user acquisition optimization blog series. Part 1 covered how you can compare different acquisition channels more accurately by incorporating predictions into the data. Channels really meant any source or campaign set up. View a video on this website if you want to learn more about making user predictions.
Part 2 will build on part 1, and show how you will use this channel comparison table to efficiently allocate your UA budget. This post is a hands-on tutorial on using the Excel solver, so be ready to fire up your own spreadsheet.
What does it mean to allocate your budget?
In the previous post we ended up with a table that looks like this:
Channel | cost | # users | cost per user | revenue | revenue per user | Current payers | Future payers | Total payers | Rev per paying user | Cost Per Paying User |
|---|---|---|---|---|---|---|---|---|---|---|
A | $1,000 | 500 | $2 | 100 | $0.20 | 3 | 20 | 23 | $33.33 | $43.48 |
B | $2,000 | 500 | $4 | 2500 | $5.00 | 20 | 3 | 23 | $125.00 | $86.96 |
C | $2,000 | 1000 | $2 | 1000 | $1.00 | 10 | 25 | 35 | $100.00 | $57.14 |
Now let's suppose you have a weekly budget of $10,000 to spend on UA. You can spend it in different combinations. For example let's call allocation S1 as spending $8000 with channel C and $2000 with channel A; allocation S2 is $6000 with channel B, $2000 with channel C and $2000 with channel A.
So allocating your budget means deciding how many "units" of each channel you want to buy. You can represent any allocation like this table below, by changing the "units" column.
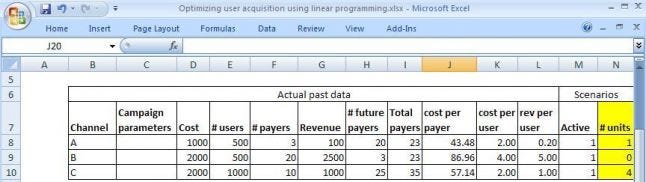
So allocation S1 will have 4 units of channel C + 2 units of channel A. Allocation S2 will be 3 units of channel B + 1 unit of channel C + 2 units of Channel A. Note that the image above is for an excel worksheet. The "units" are represented in column N.
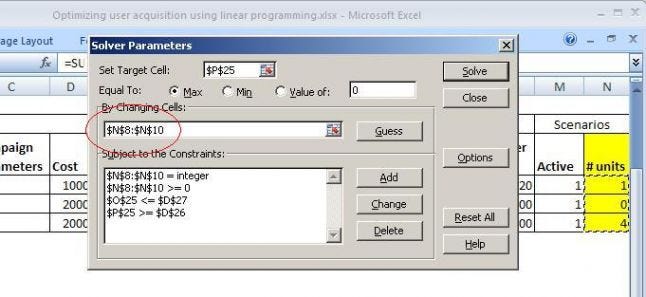
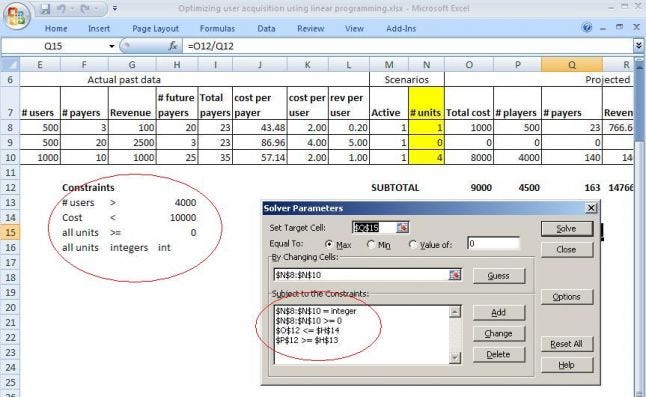
Let us look at the Excel solver now: what it does is to look through many different combinations of these "units" and tries to find one that meets all your criteria and maximizes or minimizes one metric. Excel solver is an add-in that you install with Microsoft Excel. Here's a screenshot of the Solver Dialog Box, showing that it will try to change the "units", column N rows 8-10 to find an optimal combination.
What is the metric being optimized?
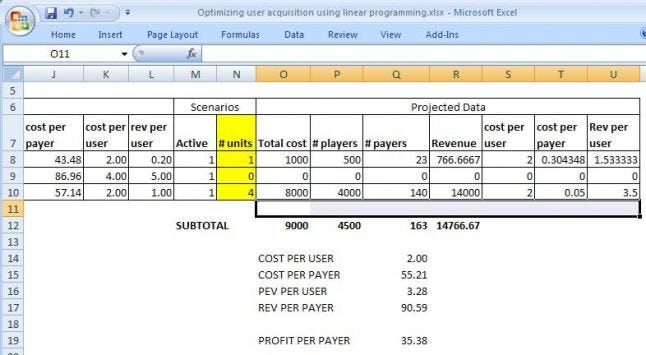
To create an "optimal" allocation, you must define what "optimal" is. In some cases it could be having the lowest cost per user, or it could be getting the most users you can, or getting the most paying users you can. So obviously we will need to calculate some of these metrics inside the worksheet. First you have to calculate the metrics for each channel, then calculate their overall values. Here is an example of how to include common metrics in your excel worksheet.
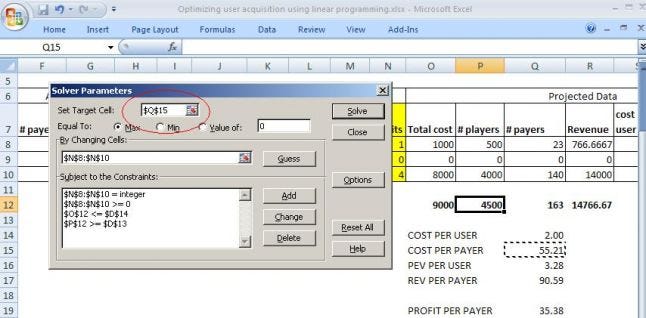
Once you have decided what your metric is that you want to optimize, you can point the Excel solver to it. This screenshot below shows the Solver Dialog with the setting of minimizing "cost per paying user" which is cell Q15.
Now quite often, your boss may give you multiple simultaneous optimization metrics. For example, they may want to have the lowest cost per user and highest revenue per payer. Unfortunately, there is no free lunch, you can only select one metric to maximize or minimize. Here you have two choices (a) create a single metric from the two, such as maximising "revenue per payer - cost per payer"; or (b) select one metric for optimization and place the other metric under constraints.
Constraints help define the search space
Constraints are additional criteria that must be fulfilled with the allocation. For example, you may want to have a minimum number of new players every week, say 4000. And of course you have the budget limit of $10000. Additionally you probably want the constraint of having integer "units" which are greater than 0. Excel solver allows you to specify multiple constraints. I have put the constraints into cells and pointed the Excel solver to use those constraints.
Now that we have set this basic worksheet up, we can run two scenarios.
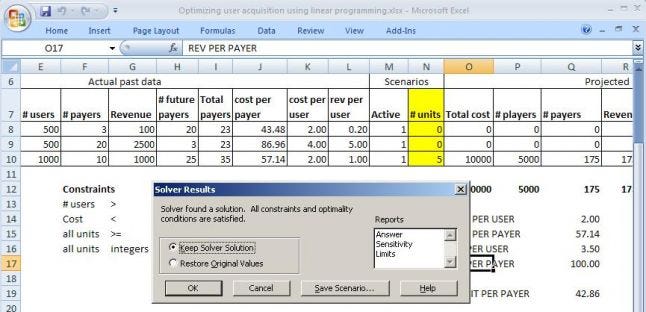
Minimizing cost per user while getting a minimum number of players
In this case, we would set the optimization metric to "cost per paying user" and select the "Min". This indicates you want to minimize the cost per payer. Then you specify the constraints of "number of users" >= 4000, and click Solve. The solver comes up with an optimal allocation of 5 units of Channel C.
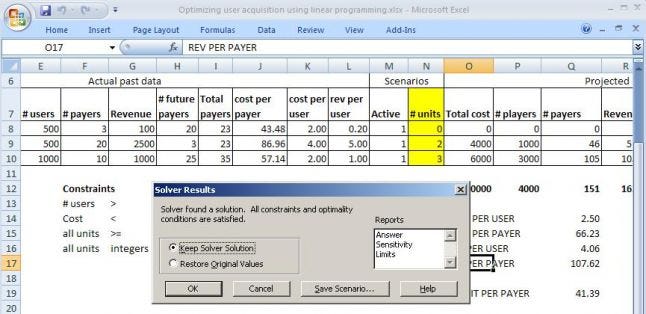
Maximizing revenue per user while getting a minimum number of players
In this case, we would set the optimization metric to "revenue per user" and select the "Max" option. The solver comes up with a completely different solution. It allocates 2 units to Channel B and 3 units to Channel C.
Other goals you can try
Try some of these other goals:
maximizing number of players while keeping "loss per player" to a certain number.
maximizing profit per payer while keeping a certain minimum number of players.
Next steps
Congratulations on finishing the introduction to using the Excel solver for UA optimization! There are additional improvements we can make to this worksheet solver. For example, what if we do not want to buy from a specific channel? How do we take into account the fact that when we buy additional units from the same channel, we may get a large "discount"? We will cover these advanced cases in the next post.
I'd love to hear your feedback; feel free to write to me at nick at sonamine dot com.
Read more about:
Featured BlogsAbout the Author(s)
You May Also Like


.jpeg?width=700&auto=webp&quality=80&disable=upscale)


