

Daily news, dev blogs, and stories from Game Developer straight to your inbox
Sponsored By
Featured Blog | This community-written post highlights the best of what the game industry has to offer. Read more like it on the Game Developer Blogs or learn how to Submit Your Own Blog Post
How to Estimate Steam Video Game Sales in 2021?
This article lays out a way of estimating how many units any Steam game has sold. It's updating the well known Boxleiter method using the largest dataset to date.
7 Min Read

This article was first published on the blog of Video Game Insights - a Steam data platform for indie developers.
This article lays out a way of estimating how many units any Steam game has sold. It will provide a right range for the majority of games.
We are using an advanced version of what’s been known as the Boxleiter method or the NB number – estimating Steam game units sold using the number of reviews they’ve got.
For example, a game with 100,000 units sold might have 1,000 reviews on steam. The ratio would therefore be 100,000 / 1,000 = 100.
We're using the largest dataset to date for this analysis with over 10,000 video games' review to sales ratios analysed.
We will cover how good of a measure total number of Steam reviews are for total sales. We will then explore how this has changed over time and which multiples to use depending on the game's release date. Finally, we will demonstrate how accurate these estimates are.
Keep reading to find out the exact multiples to use.
Why do we care and keep updating this method?
Steam sales data is not publicly available. Steamspy estimates have also become less accurate over time, leaving a gap of knowledge for indie developers and large studios alike. Steam reviews have been a good estimate for units sold for a long time now.
This article is standing on the shoulders of giants and is meant to build on the work that Jake Birkett, Simon Carless and others have done.
If you’re interested in some of the previous work done on this, read the following articles:
Jake Birkett’s analysis from 2014
https://greyaliengames.com/blog/how-to-estimate-how-many-sales-a-steam-game-has-made/Jake Birkett’s analysis from 2018
https://www.gamasutra.com/blogs/JakeBirkett/20180504/317366/Using_Steam_reviews_to_estimate_sales.phpSimon Carless’ analysis from 2020
https://newsletter.gamediscover.co/p/how-that-game-sold-on-steam-using
As Simon Carless points out in his article (referenced above), these multiples have been changing. 80 times the game’s total reviews were a reasonable proxy for units sold 8 years ago. In 2021 this is closer to 30 times.
The reason behind this is largely tweaks to Steam’s UX. Most recently, Steam has started to actively ask you to leave a review for a game you bought. There is also an element of developers becoming better at actively asking people to leave reviews.
Are reviews a good estimate for units sold?
I looked at the data leaked for 11,445 Steam games in 2018. There is over 90% correlation between the units sold and number of reviews.
Stats alert! Here's a simple multiple regression analysis using reviews, year of release and whether it’s free to play as the variables. The corresponding adjusted R2 was 78%.
Don't worry - that's as much statistics I want to go into in this article! Just wanted to get this out of the way early.
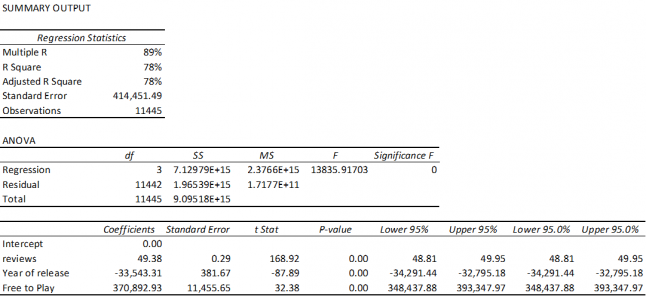
In summary, reviews are a really good predictor. Both year of release and pricing are also highly significant considerations (statistically and otherwise).
Latest view on review multiplier
We at Video Game Insights have been gathering data for c. 100 games ourselves. We also looked at the data for a huge leaked dataset of Steam games sales information in July 2018 with >10,000 datapoints.
The multipliers really have consistently come down.
Games released in 2020 are likely to be around 30x reviews.
Games released in 2014 and earlier have >70x multiplier.
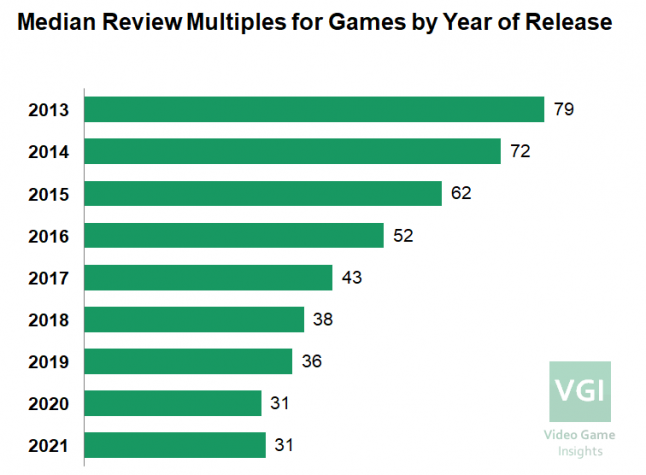
In fact, not only have the reviews come down, the range has converged over time. The graph below shows you the distribution curves of games by release year. Each line is representing games released on that year. The horizontal x axis shows you the review to sales ratio.

As you can see, the review ratio has shifted lower, but has also become more concentrated. It’s essentially becoming a better and better metric to use for sales estimation.
Another way to look at it is this heatmap of games released by year and by their respective Boxleiter ratio.

What does this mean for practical sales estimation?
In short, you should take the year of release into consideration.
Games released in 2020 onwards are very likely to be in the 20-55x reviews range while games released before 2014 are much more likely to be in the 40-100x reviews range.
The estimates we use at VG Insights follow a simple rule of thumb based on the above analysis:
 for 2021")
The above graph is the key summary you should take away from this article. It lays out the range of multiples you should use as a proxy for games by year of release as well as the 'best guess' multiple to be used (the green diamond).
For example, Valheim, released in 2021, has 255k reviews on Steam at the point of writing this. Using the 20-55x review multiple range, we know they've sold between 5-14m units up to date. If we want to put a number to it, we'd use the 30x multiple - resulting in 7.7m units sold.
For historical data on Valheim, using the same methodology, we've captured that in a graph - https://vginsights.com/game/892970
Note that the exact multiple might be more off for some games. In Valheim's case, it's very close though! According to VG247, they had sold 6.8m by end of May The speed of sales has significantly slowed since then.
How accurate are review based sales estimates?
On an individual games basis, the ranges used are a good predictor of units sold for most games. They give you the right ball-park.
For our fairly large dataset of games, these ranges ended up being accurate for over 80% of the games.
At an industry level, this looks even better.
The estimated total units sold for the 10,000+ games we looked at was 7% higher than the true units sold.
Note – this is a simplistic estimation method and will have outliers. There are some games where this method still wildly over- or underestimates the units sold. Valve’s own CS:GO that has a ridiculously high sales to reviews ratio, for example.
How can this method evolve going forward?
There are several interesting trends that I noticed when playing around with this data. Higher priced games tend to have lower multiples. MMOs have higher multiples while sports and racing have lower multiples than average.
We will be posting more on genre and pricing impact to the Boxleiter method in the coming months.
This article was written by Karl Kontus, one of the co-founders of VG Insights. We’re creating a Steam data platform for indie developers. If you found this insightful, check out our platform and other articles on https://vginsights.com/
Read more about:
Featured BlogsAbout the Author(s)
You May Also Like


.jpeg?width=700&auto=webp&quality=80&disable=upscale)


