

Daily news, dev blogs, and stories from Game Developer straight to your inbox
Sponsored By
Featured Blog | This community-written post highlights the best of what the game industry has to offer. Read more like it on the Game Developer Blogs or learn how to Submit Your Own Blog Post
Genre Viability on Steam and Other Trends - An Analysis Using Review Count 2
Does genre affect your success odds? Using a database of review count-based revenue projections, we dive deep into sales trends on Steam. We look at which tags sell the best, as well as sales trends in release date and review score.
12 Min Read

As a career indie developer, I tend to think a lot about market viability for different kinds of games. It might sound like a strange hobby, but I enjoy browsing the steam store and trying to analyze games, approximate how well they're selling, and try to unpack the reasons behind their success or failure.
So one fateful day I got to thinking: Wouldn't it be nice to have a spreadsheet of every game on steam, its tag, genre, release date, and approximate revenue? I thought it might be fun to look for patterns in the data, particularly in the tags. Well I set out to collect this data.
Note: The title of the article says genre, but technically what I look at in this article is tag, which is more granular and I feel more useful. Throughout the article I use the words interchangeably, since I kind of see tags as a more granular form of genre.
Approximating A Game's Revenue
 Approximating a game's revenue is a useful tool for an indie developer. One of the simplest ways to guess at how many owners a particular Steam title has is to multiply its total review count by 50 (according to Jake Birkett the actual range of this number varies between 30 and 100, but 50 is a nice conservative number). Once you have the owners, you can multiply it by the US list price, and then multiply it by about 0.38 to guess the net revenue. Here's how we get to 0.38:
owners * US price * 0.93 (VAT) * 0.92 (returns) * 0.8 (avg regional price) * 0.8 (avg discount) * 0.7 (platform cut)
This is of course another approximation, because a game's actual net revenue will vary quite a bit based on how deeply its discounted, and the geographic composition of Its sales (which effects average regional price as well as percentage of sales subject to VAT). Also the average discount multiplier tends to decrease throughout a game's lifetime, as the discounts get deeper. 0.8 is our game's (Eastshade) average discount after 8 months, our deepest discount so far being 40%.
Another important factor in guessing a game's eventual revenue is how far the title is into its sales curve. Games which released recently have only made a portion of their lifetime revenue. To guess at the lifetime revenue, here are some numbers that are helpful:
On average, a game makes the following percentage of its lifetime revenue (cumulative):
13% after one week
33% after three months
58% after one year
75% after two years
87% after three years
95% after four years
for simplicity's let's call a game's lifetime revenue 100% after 5 years (sales generally trickle very slowly at this point)
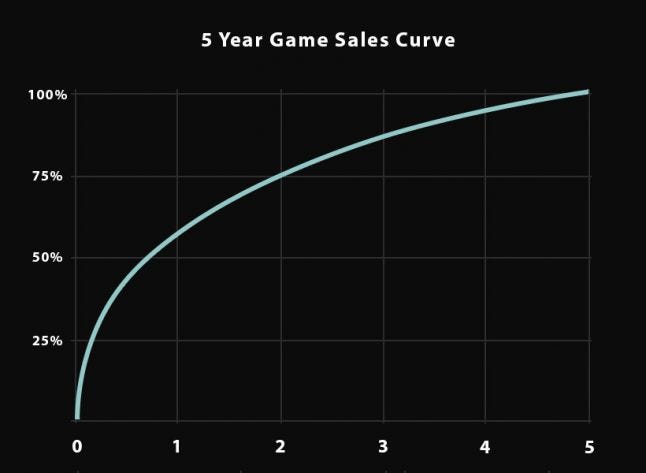
These numbers, like many of the numbers in this article, are approximate. Some games have a larger long tail, making revenue well beyond 5 years, and some peter out more quickly. I've settled on these numbers based on sales data I've been able to gather from other games (including our own), and also by looking at the review graphs of various games on steam, to see how the incoming reviews taper over time. We can use these numbers to project the lifetime revenue of a given game, as long as we know its current approximate revenue (we can use reviews at mentioned before) and its release date. This calculation goes like this:
current approximate revenue * (1 / current percentage of lifetime)
So let's say a game is 7 months after release, we can use our graph to see that statistically this might be around 40% of its eventual 5 year revenue, so we would plug that into "current percentage of lifetime" and get a multiplier of 2.5. Side note - I'd be very grateful to any dev with older titles who can let me know how this sales curve holds up to their data! Thanks to Jake Birkett's article I'm pretty confident about the accuracy of the first year but the later years of this curve was hard to collect data for, and I'm not super confident about the accuracy yet.
So that is how I approximate and project the revenues in my data. Bear in mind this method is quite simplistic, and is prone to a number of issues. For instance if a game has reduced its price since its launch my formula will underestimate the revenue. Another big issue is that the average discount rate varies a lot and I don't have data for discount history to correct this. Then of course, each number in the formula has a certain range of variability, and the result is that these estimates might be anywhere from 50% to 300% of the actual figure. Side note - I'd be very grateful to any fellow developer who let's me know how these projections stack up to their game's actual sales!
Here is the result of almost every game on steam using this formula.
Note: Early Access games do not estimate well because the script pulls the 1.0 release date. Also I wasn't able to pull data for any game with an age gate.
Is the Games Business Getting Harder?
The declining median and average revenues of steam games are often cited to back up the cry of the so-called indiepocalypse. I'd like to draw your attention to another way of looking at the numbers: Percentage of games who made over a certain amount of revenue. Its no secret that many titles on steam nowadays are very low effort, or are otherwise not seeking to be particularly commercially competitive. I personally feel Steam's algorithm is pretty good at burying games with low conversion rates. So if, for instance, 30% of Steam's titles are projecting a net revenue of over 200k, as long as your game is in the top 30% in terms of product quality and marketing effort, its reasonable to expect you have a great chance at netting over 200k. Let's check out the numbers: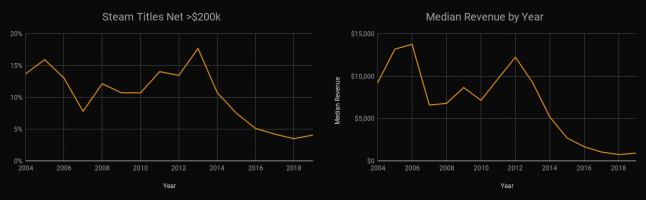
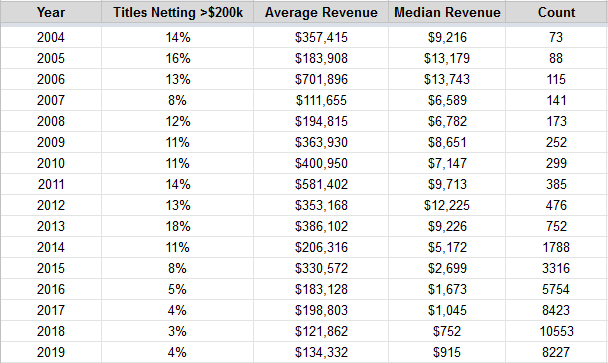
The bad news is that, yes, we've been declining. Our decline, however, seems to have ceased for now. But our declining averages have coincided with an increase in game counts. How many of these titles do we have to worry about competing with? Well as it turns out a great many of these titles are getting less than 10 reviews. I'd venture to say most of these titles are of no concern to a career indie dev as far as competition goes. As you can see below, things look a bit rosier when we filter out titles with under 10 reviews. There's even a nice uptick this year (so far) in both success odds and median revenue. 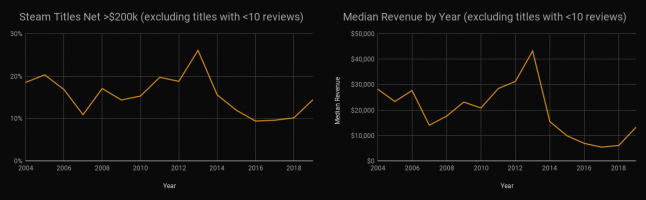
So is the games business getting harder? Its difficult to say because while the average revenue per game on Steam is by most measures declining since 2013, its easier than ever to create games, and indeed, easier than ever to put them on Steam. The influx of low effort games is bringing down the revenue averages, but is the top end of the market actually more competitive? Is it actually harder to make money for a high effort game developer who creates polished products and takes their marketing efforts seriously? My intuition tells me yes, it is getting a bit harder, but its no where near as grim as the declining average revenues would indicate. One just has to look at the quality of products coming out, and ask themselves if they can make a product which is competitive with whatever revenue bracket they would need to be in to recoup their effort. This is where picking a game type that has market demand comes in. Different tags on steam have different odds of success. We'll look at that in the next section.
Revenue by Tag

The idea for this project actually popped into my head while browsing the tags on SteamSpy. I noticed the median revenues per tag did not line up with what I intuitively felt to be true about certain genres. Some tags had very high median revenues which I felt were low demand genres, and others had low median revenues which I felt should be relatively hot. It occurred to me that the median did not tell the whole story. For instance if a certain genre is particularly boom or bust, let's say 40% make mountains of money and 60% flop with less than 5k in revenue, the median would show a very low figure. Yet that genre I feel would be extremely viable for a career indie developer, because a high effort developer is not competing with the bottom 60% (I would say a high effort developer is really only competing with the top 10% of games on Steam, the rest will not rank well enough for visibility). The average is an even worse figure to look at, because a few mega-hits can throw it off considerably. I think % of games over $ revenue is a great stat because it shows you exactly what benchmark of games you have to compete with. Okay and now for the interesting bit!
Don't forget you can sort the rows by a certain column by right clicking the letter of the column and clicking "organize A-Z/Z-A" (this will only change how the sheet looks for you). On the Revenue by Tag sheets, each revenue range for a tag links to the games in that collection, so you can inspect them to see what kind of game it takes to be in that range.
Obviously the most interesting part of this write-up is the data itself, which you can now peruse and make your own conclusions about, but here is a random mishmash of observations I made.
I would be weary of tags with low counts (<30) because there's just not enough data. I'd also be weary of tags with high counts (>2000) because they are too ambiguous to be useful identifiers ("indie" being the most extreme example). This data has shown me just how useless the "indie" tag really is at this point. I recommend not tagging your game with it at all.
Some tag stats are obviously misleading. Batman is statistically the best tag in All Time, but there is a relatively small amount of titles (barely making my minimum 10 cut to even be included), and all the games in there had rights to the use the Batman IP, which skews that category toward all larger budgets. There are quite a few tags like that.
According to this data, the "Cats" tag is middling in viability. It seems merely including cats in your game is not a recipe for great sales. The tag is full of unremarkable entries, however that is also the case for a lot of far better performing tags.
Moddable is a great performer. At first I wrote it off because I guessed moddable would be highly biased toward big budget games—I thought only a big budget had the bandwidth and community to bother with mod kits. But after more inspection that might not be the case. It has over 500 titles and there are plenty of small and middle budget titles in there. There might be something to that.
Some tags that consist of a high rate of age gated titles like Horror may be misrepresented, since my script could not pull their data.
Does Review Score Matter?
This was an easy one to look at once we had the data. Here is a graph of review score vs revenue. I grouped the games by percentage point (100 groups), and then averaged the projected revenues for that group. I excluded any group with less than 50 titles in it, because in a set that small one top-seller with a bad score could throw off the average (one review bombed triple-A title for instance). That's why the graph starts at 30. There were just so few games with a review score under 30 that the data was extremely noisy. I also clamped the max revenue of any single game to 5M, to prevent outliers making the data more noisy. 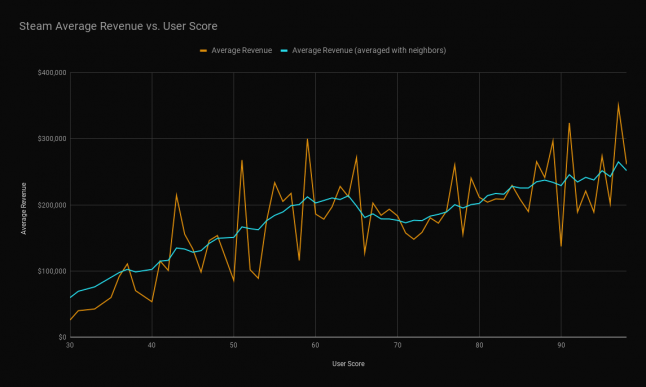
I was pretty convinced review score didn't matter much. I'd seen a number of articles making that claim, and had heard a few publishers say the same. I think this graph pretty thoroughly proves otherwise, at least in the broadest general trend. The correlation is very clear, even if the data is a bit noisy. I'm not really sure what's going on around the 70% area.
Conclusion
I'm by no means the first to say this: I feel the most important marketing decision for a game developer is the kind of game they choose to make. I believe the current market demand for a game's type is critical to its odds of recouping. There are, of course, some games that expose market interest nobody knew existed, and indeed, seminal games which ascend above their genre's usual market size. But by and large, games sell within the scale of their genre's market size. Therefore its wise to consider market viability when choosing what kind of game you want to make (if you're doing indie development as a living anyway).
The tags on steam are simplistic, inconsistent, and don't tell the whole story. As far as the tag revenue data goes, while I feel this data is somewhat useful in assessing market viability, for me its chiefly fun and interesting to look at. To be clear, I gathered this data primarily because I'm fascinated by it, not as a soul means to pick what our next game should be. I feel individual case studies are far more important for market research overall, and I also feel that an honest gut assessment of an individual game idea is more useful than the broad data.
TLDR where's the data? Here is the full data. Don't forget there are multiple sheets at the bottom.
Twitter: @eastshade
Read more about:
Featured BlogsAbout the Author(s)
You May Also Like


.jpeg?width=700&auto=webp&quality=80&disable=upscale)


