Game Seasonality: How to Predict Your Numbers in Summer
Why is your revenue dropping in summer and how to calculate seasonality of your game? In this article, we'll look at the most common examples of seasonality and will learn to manage forecasts basing on that knowledge.

As the old saying goes, we have good news and bad news. The good news is that we're already more than half way through summer. The bad news is that the revenue of a mobile application, game or any other product often drops during the hot months, which has a perfectly reasonable explanation.
In this article, we'll talk about such a phenomenon as seasonality in the values of key project indicators, discuss how to find it and use it for your own good.
WHAT IS SEASONALITY?
Any recurrent fluctuation of the time series is usually called seasonality. Supposedly, you have data on product sales for each day for three years. Our experience in application analytics shows that seasonality is likely to exist in your time series, i.e. you may note some cyclicity in the behavior of the indicators.
Most often, seasonality is the most pronounced by the days of the week and by the months. Let's take a look at each of them separately.
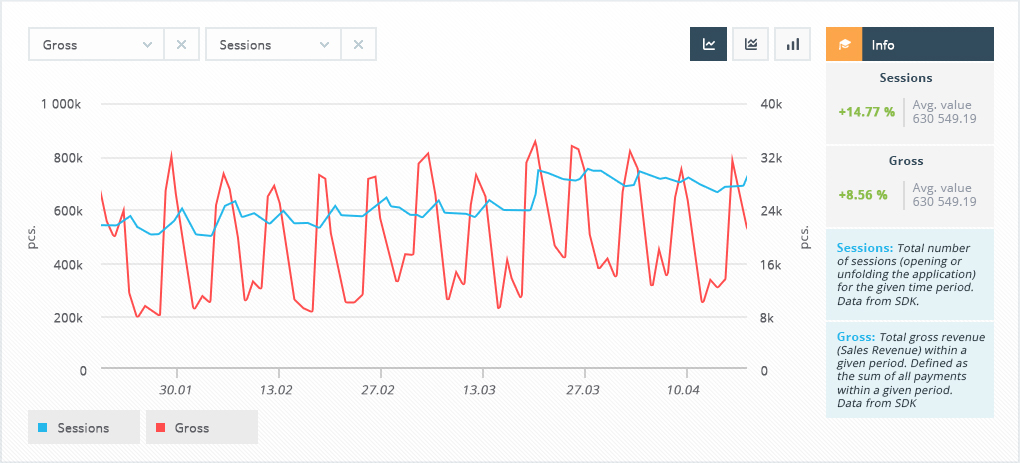
Weekly seasonality consists of growths or falls that correspond to different days of the week. It can be explained quite logically: there are weekdays, and there are weekends. From weekdays, it is possible to allocate Monday (usually with a minus sign) - a day of calmness after a noisy weekend, and Friday (usually with a plus sign) - a day when you can afford a little bit more than usual. On the weekend, unlike weekdays, the online graph behaves differently (because you can play from the very morning instead of going to school or work), as well as the other metrics (for example, ARPDAU - the average revenue per daily active user).
Here are some examples:
in many games, the audience on weekends is more active than on weekdays;
on the other hand, the revenue indicators are averagely higher on weekdays with a peak on Friday (which is why Friday is an excellent day for promotional campaigns);
especially interesting is the fact that the retention of users registered on Friday is slightly higher on average than that of users registered on other days. Probably, this can be explained purely psychologically: by installing application on Friday, you increase your chance to open it the next day as it's a day off.
By the way, the last example shows an important thought. Seasonality applies not only to quantitative product metrics (audience or gross), but also to qualitative indicators (retention, ARPU). That is, users even behave differently on different days.

Monthly seasonality. If you aggregate the indicators by month (from DAU to MAU, and from ARPDAU to ARPU), you may also notice some seasonal changes:
as we said above, in many products hot months are on the contrary the "coldest" in terms of the number of the audience, its interest, and revenue from it;
but cold months, on the contrary, attract more users (when it's cold outside, you may spend time at home playing games);
especially seasonality is expressed in December - this is usually a month of general upswing: both in terms of the audience and the money received from it.
However, seasonality is not limited to weekly or monthly. A little later we will talk about how to find the optimal cycle duration, and for now - a few non-trivial examples:
in one of the games we saw that the optimal cycle duration in ARPDAU performance is not 7 days, but 14; we explained this by the fact that people receive the payroll once a fortnight;
in some products, by the way, peaks are especially noticeable on those dates of the month, which could be divided by five (and these are the payroll days also);
we also found products in which the optimal cycles were 3, 9, 11 days - and in all cases, this was related to the internal events in the product (e.g. tournaments).
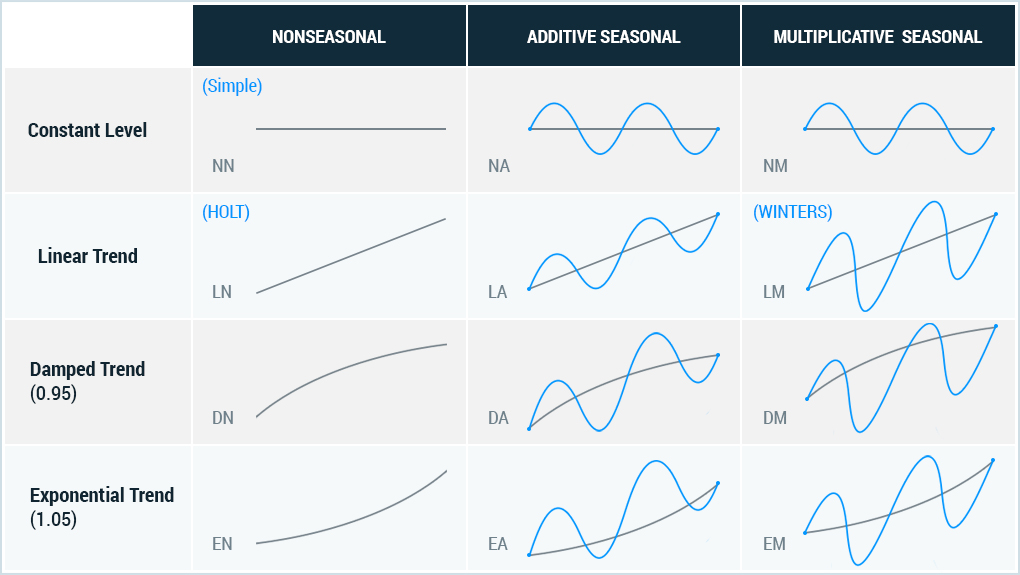
There is one more way to classify seasonality. It might be additive (when seasonal coefficients are constant in time) and multiplicative (when seasonal fluctuations grow or fall with time). In this article, we reviewed the additive seasonality, as it's more common basing on devtodev's experience with multiple projects.

HOW TO FIND SEASONALITY?
Below you can find a detailed description of the algorithm for calculating seasonality (by the example of finding seasonality by the days of the week).
To make it easier for you to understand the process of calculating seasonality, we have prepared a file, in which all the following actions have already been performed. However, if you use this file to substitute your data into it, calculate seasonality and make forecasts, we also won't mind.
CLEARING DATA FROM OUTLIERS
Preliminary the source data must be cleared from outliers - atypically high or low values of the indicator that are outside the expected range. Often on the graph, such data looks like significant peaks or, conversely, drops almost to zero, which exceed the usual values by several times.
The cause for such outliers might be peak sales on a holiday, the failure in the tracking system, or any of the other one-time factors that somehow influenced the metric.
Why do we need to clear data from these outliers? Such values distort the results of calculations and can lead to errors in the forecast. Some statistical indicators, such as standard deviation and arithmetic mean, are dependent on the outliers and, by including them into the calculation, you may draw the incorrect conclusions.
So, to clean up the data, there are a number of approaches that allow you to assess which suspiciously high or low value can be considered an outlier, and which cannot.
We will not go into more detail on clearing data from outliers, because our main task now is to calculate the seasonality, but nevertheless, we must always remember it when analyzing the data.
CALCULATION OF AUTOCORRELATION
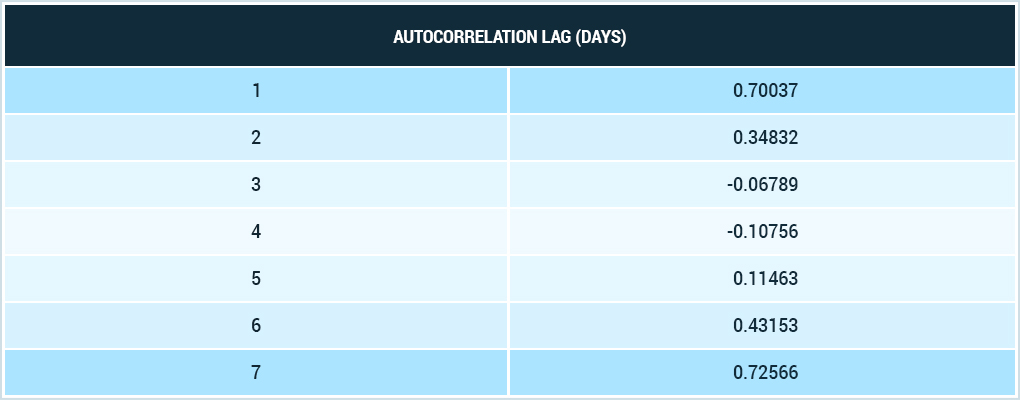
So, the second stage of calculations, which is applied to the already cleared data, is the calculation of the autocorrelation lag.
Autocorrelation is a relationship between the values of a time series taken with a shift. It is used to identify trends and cyclical fluctuations of data in a time series.
For its calculation, Excel uses a standard function CORREL, which calculates the coefficient of autocorrelation between two ranges of data. These ranges are arguments of the function and are shifted relative to each other: if we are looking for the first-order autocorrelation coefficient, the first range includes the time series values from the first to the last but one, the second range contains all values starting with the second one. We get two ranges offset from each other for one day.
To search for the coefficient of the second order, the ranges should be shifted by 2 days - the first does not include the last two values of the time series, the second does not include the first two.
This way, we calculate the autocorrelation coefficients for 7 orders and find the maximum among them. It will be an indicator of the day with the highest autocorrelation.
If the maximum coefficient is obtained for autocorrelation of the first order, then this series does not contain any trends and dependencies.
And if this coefficient is maximal for the 7th order, it means that series contains cyclic fluctuations with a periodicity of 7 days.

CALCULATION OF LINEAR TREND COEFFICIENTS
Next, we will build a trend for our series to subsequently make a forecast on it and determine how the chosen indicator will behave further.
There are several types of trends, which can describe the metric (linear, exponential, logarithmic, polynomial, etc.). We will use a linear method as it's most simple to build and perceive, and at the same time it shows well the dynamics of the metric.
The linear trend is built from an equation of the form y = ax + b, where a and b are coefficients, and x is the ordinal of the day (column D in the given example). So to calculate the equation, we need to calculate two coefficients.
This can also be done with the standard Excel function LINEST, the arguments of which are two data sets - the metric that's being examined and the ordinal numbers of the days.
Using this formula as an array function (Ctrl + Shift + Enter), we get two coefficients, which we then substitute into the equation.
BUILDING A TREND LINE
To build a trend line, use the previously calculated coefficients - a and b. The only variable parameter of the equation is x - the ordinal number of the day. Due to this, the trend line can be extended for several days ahead, in our example it's 7 days (column I). Thus, we obtain a further dynamics of the change in the metric.
CALCULATION OF SEASONALITY COEFFICIENTS
The next step for building a linear trend forecast is to calculate the seasonality coefficients.
To do this, determine the deviation of the metric values from the trend line (column K), and then find the average value of these deviations, depending on the day of the cycle. These average values are the desired coefficients.
IMPOSITION OF SEASONALITY ON THE TREND LINE AND BUILDING A FORECAST
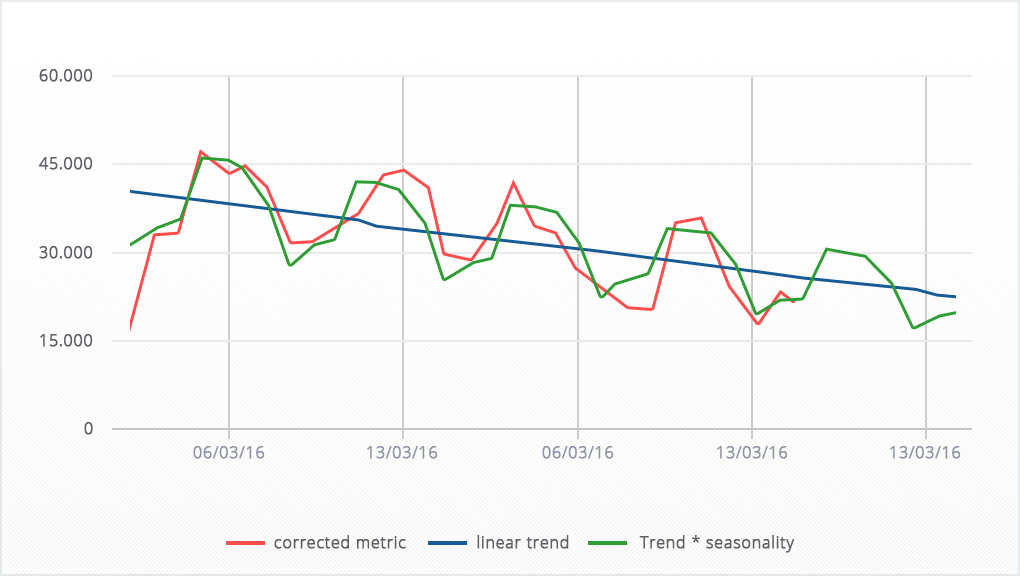
To complete the forecast, you need to "overlap" the trend with the seasonality.
To do this, multiply each value of the trend line by the coefficient of seasonality of the corresponding day (column L).
This will lead the trend line chart to the familiar form - with regular fluctuations depending on the day of the week.
And since before we extended the trend for 7 days beyond the available data, the seasonality will spread to the forecasted part of the trend line, thus providing a forecast for the metric for the next 7 days.

WHY YOU NEED TO KNOW THE SEASONALITY
First of all, to predict your revenue more accurately and to make correct decisions based on these forecasts. For instance, do not plan a massive traffic purchase in August, but wait till September to do it. The question of revenue planning in general is very important, and every company is probably working on it. Seasonality is one of the ways to make your forecasts much more accurate.
Secondly, seasonality can be used for your own benefit. If you know that in December you will have many users and the average revenue per user will be high, then it's worth to increase it even more by offering these "hot" users of the cold month more favorable discounts.
There is an interesting question: is it possible to fight seasonality? Let's say you know that in July ARPDAU will be the lowest for you in a year. Should you try to increase it and bomb users with tempting July discounts?
Our experience tells us that it's useless to fight seasonality: if your users left for a summer vacation, then they would remain on their vacation, no matter what you do. It is better to focus on multiplying seasonality of the high months and increasing your revenue even more, rather than trying to resurrect the revenue of the low months.
A FEW IMPORTANT THESES
And again, let’s mention outliers. Before calculating seasonality, make sure that your data is cleaned from them. Any leap in the source data (and leaps are often caused by a simple technical error) can significantly distort your data.
Let's say that on one of the days in July the revenue was a hundred times better than the usual average. If you do not clear the series from outliers, then you can get that July is the most profitable month, and incorrectly plan a general discount based on this data. And only later you may find out that the table probably lost the bit capacity on that day, and in fact the number is quite average.
By the way, in our file, outliers purification, of course, is envisaged.
Seasonality depends on many factors:
application genre (imagine how surprised the representatives of tourist services would be when reading about the summer revenue decrease);
country, language, religion (for example, in Iceland almost everyone goes on vacation in summer, and it's even almost impossible to schedule a doctor's appointment);
weather (the hot May might be better than the cold June);
any other factors.
That is why the conclusions mentioned by us (about the good Friday, or unsuccessful summer) cannot be applied to all the products at once - this is only our experience that's based on the games' analysis.
It is better to calculate the seasonality of your project by yourself and draw conclusions based only on your calculations. So download the file, calculate seasonality and make more effective decisions!
This article first appeared on devtodev’s Education Center: SEASONALITY OF THE PROJECT: DO NOT BE AFRAID OF SUMMER RECESSION.
Vasiliy is a Lead Analyst at devtodev — intelligible game analytics system that helps to identify problems in app’s performance, find the points of growth and make the most effective decisions.
Read more about:
BlogsAbout the Author(s)
You May Also Like


.jpeg?width=700&auto=webp&quality=80&disable=upscale)


