

Daily news, dev blogs, and stories from Game Developer straight to your inbox
Sponsored By
Game analytics methods and two tools for game designer
What metric should be monitored depend on what game it is, and what is the goal. But there are also metrics that are unique or important only to a particular type of game. No game is the same. You should also choose metrics that is specific for your game
9 Min Read

Like the medical intervention based on the analytics of patients body metrics, game intervention, say, game design, events and sales, localization should also be based on analytics of game metrics. Game is art, but today internet and all kinds of free analytic tools equip us with the powerful tools for monitoring game metrics anywhere, anyway and anytime.
What metric should be monitored depend on what game it is, and what is the goal.
In all f2p games, some KPI should be considered to monitor, for example, DAU, LTV, ARP, ARPPU, etc. They are the KPI that all operation are concerned.
But there are also metrics that are unique or important only to a particular type of games. For example, in social games, you should monitor metrics about social aspects. Like how many friends has average people had, and how many gifts had they sent. In MMORPG, you should monitor community metrics. Like how many clans have been created, how many conversations have occurred every day.
But, don’t forget, No games are the same. You should also choose metrics that is costumed for your game.
Your game is ill?
when a person get ill, some of his body metrics will be abnormal, say, if a person catch a cold, his body temperature will be plus 37C°,and blood pressure will be high too, and body movement will decrease. Game are similar, if your tutorial is compulsive and hard to learn, users will leave game, the churning rate will surge in first day, and the average retention will be lower than other games, your monthly revenue will decrease.
One aspect of your game’s situation will be reflected on many metrics. So you can inspect and integrate them to support your hypothesis.
Diarrhea and diabetes are different sick, so they should be reflected within different metrics. Level design problem is different from item design problem, so they should be monitored through different metric combination.

Medical intervention to improve patient’s health based on analytics

Game intervention to improve performance based on analytics.
Don’t take wrong pills. Or no-ill to take pills.
Some external factors should be excluded from analytics, you are ill, but that because you exposed yourself in weather pollution, not because took wrong foods. You should not take cathartics instead keep indoor. If you have no ill, but always go to hospital to inspect body, you may be wrongly diagnosed with disease one time. Then you took pills soon? No.
Those external factors in game analytics should be excluded from reasons too. Seasonal factors, incidences, and events are those factors which affects statistics but should not confused with design problems.
Almost all f2p game are distributed in main platform, and those platform also provide free analytics tools you should consider.
Take power-up and get more strong

take pills to get more strong
With Analytics, not only you can cure your game, but also make your game more strong. Take the right pills to power-up your game, boldly try your intervention and see and adjust, you will get the perfect balance. Your health is balance, healthy game is art of balance too.
Example of data-driven design of Texas Hold’em
·Multi-windows feature
We rapidly developed and applied the first browser-based multi-windows feature, then monitored metrics, we found that there was a big increase in average player rounds and fees in a given time. Then I played the feature, found overall the experience is excellent, but some inconveniences of the windows controlling and costuming. I asked some co-workers, they response same problems, and gave me some new insights, so I decided adjusting One-key Control and Custom Windows functions to improve those aspects.
.png/?width=700&auto=webp&quality=80&disable=upscale)
1st edition
In just a week, we quickly developed 2nd edition and applied it. When monitoring player rounds and fees metrics, the 2nd edition was better than 1st edition. Our real users had reported they had more seamless experiences that support my designing.
.png/?width=700&auto=webp&quality=80&disable=upscale)
2nd edition
·Premiums of opening a new table and full of a table feature
The “premiums of opening a new table and full of a table” feature is also a data-driven example. We created this feature to encourage onlooker players open a new table when all table is full, and keep on-going player playing when a table is full.
.png/?width=700&auto=webp&quality=80&disable=upscale)
.png/?width=700&auto=webp&quality=80&disable=upscale)
We applied this feature, and monitor metrics of average rounds time and overall play rounds of high rank tables. We hypothesized the premium will induce onlooker players to open more table, then added overall play rounds, and on-going players to play more rounds because peer pressures of getting lottery chance of entire table.
The metrics confirmed our hypothesis. The average time of a round and overall play rounds of high rank table increased. But at some highest rank table, the play rounds decreased. Why? Our service team asked some players, they responded that the prompt panel interrupt immerse, they fell annoyed. So we removed the function in the highest tables. Then the number of metrcs come back to previous level.
Below I briefly introduce two free but useful analytics tools for your uses. You can find detailed imformation in official developer website.
Facebook analytics
Overall Facebook analytics is very flexible and meets main needs of game operation and design.
The Facebook analytics can let you custom your events to monitor metrics that you want to, and include Funnels, Cohorts, Segments those basic game analytics tools to help you define what specific aspects to analyze.
Analyzing across platform
The great strength of the Facebook anlytics is that you can anlytize the data across different platform, like android, iOS, web. One user will be seen as an indiviual user. If you have games across Canvas, tablet and smartphone and user longin using same account, you can analyze them applying the same events.
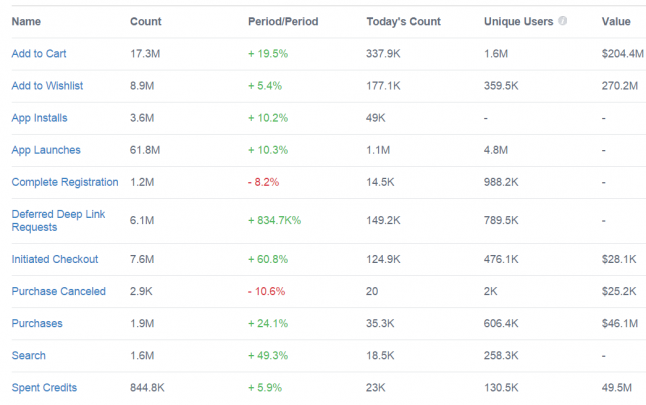
Events
You can flexablely define events to form metrics. it is really powerful that you can monitor what you want to in the game, say, if you have a event of sale of some items, you can monitor those sale metrics. If you have a new skill or new avatar on providing, you can monitor how many users have choosed the new skill or avatar.
There are some basic metric all social game could be track:
When does player leave the game?
How long is the session?
When does player uninstall your game?
What is the average time of upgrating to each level?
How about each item’s sale?
For social games, there are some basic mertic should be track:
How many new friends users had sucessfully invited?
How many request had users asked?
How many gifts had users sent?
How many friends room had they visited
Cohorts for analyzing game design
You can use Cohorts to analyze the outcome a game design, for example, if you add a new level, you can monitor the retention rates before and after that design, and see whether the retention rates increase or decrease. Below are the chart of install-lanch rate(retention), you can see after imply the new design in Mar 10, your retention rates have improved obviously. That means it is a good design.
.png/?width=700&auto=webp&quality=80&disable=upscale)
Overall retention rates
.png/?width=700&auto=webp&quality=80&disable=upscale)
Before design
.png/?width=700&auto=webp&quality=80&disable=upscale)
After design
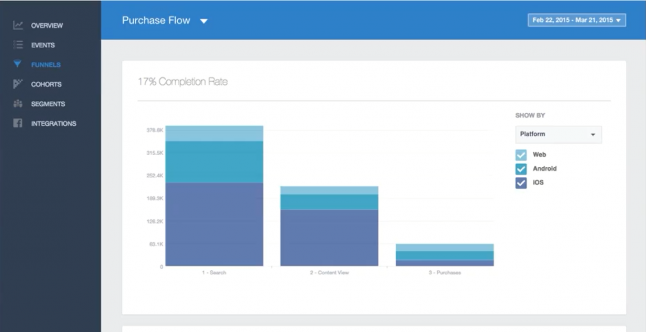
Funnels for improvement in each stages
You can use funnels to see each stages of a task, like you buy something, you will launch app, browse items, add items to cart and purchase. The number of users in each stage may decrease. If you improve the experience of each stage, the number of users may increase accordingly. So you can try your design and improve the outcomes.
Funnel is vital for purchase process, users will churn in each step. You should carefully design and test your outcome with constantly iteration. A/B test is a good way to tune your design.
And a task that require multiple procedure to complete is suitable for Funnel. Why user accept a quest and give up in a certain step can be analyzed with Funnel.
.png/?width=700&auto=webp&quality=80&disable=upscale)
Segments to find problem and chance
You can use entries of the categories, like language, countries, platform implied on funnel, and you may see there are big differences. There may be some problem in some entries, say, like in iOS, the purchase rate is low, so you may find chance to improve preferment of iOS platform. Then you modified the purchase experience, then you see the outcome. Your purchase rates in iOS has improved, so you do great job.
.png/?width=700&auto=webp&quality=80&disable=upscale)
Apple analytics
The greatest strenth is only Apple can provide App Store views and App Units data. You can see overall metrics in first screen of the app.
But,I think it will be better to let user custom events like Facebook for specific purpose.
You can also see Sales by Territory, retention, and App Unites by Platform metrics.
.png/?width=700&auto=webp&quality=80&disable=upscale)
You can freely choose measures and be filtered by dimensions. Apple provide combinations metrics of them.
.png/?width=700&auto=webp&quality=80&disable=upscale)
You can also combine two metrics to form new merits you may care.
.png/?width=700&auto=webp&quality=80&disable=upscale)
You can show two metric using dual axis,
.png/?width=700&auto=webp&quality=80&disable=upscale)
Or show using ratio.
.png/?width=700&auto=webp&quality=80&disable=upscale)
You can trace web site sources of App page when user using mobile Safari
.png/?width=700&auto=webp&quality=80&disable=upscale)
You can create a campaign web link to trace sources
.png/?width=700&auto=webp&quality=80&disable=upscale)
The map of daily retention is very clear, which is distinguished by colors. You can monitor retention rates before and after your intervention. The influence will be distinct if your intervention is very good.
.png/?width=700&auto=webp&quality=80&disable=upscale)
Read more about:
BlogsAbout the Author(s)
You May Also Like


.jpeg?width=700&auto=webp&quality=80&disable=upscale)


