

Daily news, dev blogs, and stories from Game Developer straight to your inbox
Sponsored By
Featured Blog | This community-written post highlights the best of what the game industry has to offer. Read more like it on the Game Developer Blogs or learn how to Submit Your Own Blog Post
First-year Wii U sales suggest grim lifetime sales
We've now seen what a full year of Wii U sales look like in the U.S. What does history tell us about where the platform could be in five years?
3 Min Read

By now, the historically weak sales for the Wii U are old news, but today I want to follow up on an idea I'd been considering for a while but just hadn't had time to flesh out. The basic question is this: How much of a console's five-year sales are typically made in the first year?
If we look back to consoles launched since 2000 -- the PlayStation 2 and newer -- the answer is pretty straightforward. I've put the figures together into the diagram below.
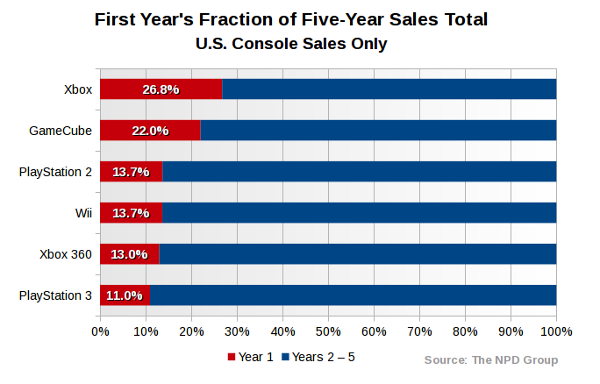
As expected, there is a range of fractions here, and the fraction depends greatly on the kind of success the platform finds in the marketplace.
Take the PlayStation 3, for example. That's a platform that experienced an extremely hostile market during its first year. It wasn't until the first major revision, the introduction of the 40GB PS3 without backward compatibility in late 2007, that the system began to sell at a reasonable pace. Therefore, its first year was 11 percent of the system's five-year sales total.
In the case of Nintendo's Wii, the first year was extremely supply-constrained, and therefore it wasn't until Nintendo was able to fully feed hardware to retail outlets that its sales reached their full potential. In that case, the system's first year accounted for just 13.7 percent of the five-year installed base.
On the other end of the spectrum, the original Xbox saw over one quarter of its five-year total achieved in the first year. The explanation here is twofold: the system sold quite well out of the gate -- over 3 million systems in just 12 months -- but then was abandoned at the four-year mark when the Xbox 360 arrived in November 2005.
If the Wii U plays out between the extremes here, then its five-year sales total will be in the 12-13 million system range on the high end and in the 5.5-6.0 million system range on the low end.
Those figures are both terrible.
Take the struggle that Sony endured from November 2006 through October 2011, a period when it was constantly fighting for attention while both the Nintendo Wii and Microsoft Xbox 360 found great success in the U.S. market. In that period, the PS3 moved over 18 million systems in the U.S. But that would still put it six million systems ahead of the best case for the Wii U, in this model.
If, instead, the Wii U sales so far are really just about 25 percent of the system's sales through the end of 2017 -- well, at that point we're looking at a console that still beats the Dreamcast in the U.S. but just by a couple million.
Finally, there is always the case that history isn't a good guide here, that Nintendo's first-year sales will actually be less than 11 percent of its five-year total. Say, for example, that its sales right now are just 5 percent of the total in five years. Then we're looking at a system with an installed base of 28 million systems, which puts it in the same company as the PS2 and Wii.
Whatever happens next, Nintendo has to bend the sales curve here or it's destined for miserable sales of its flagship console. Like the rest of you, I'll be watching closely to see what Nintendo chooses to do at the end of January 2014 when they announce their fiscal third quarter results. That's the best opportunity they'll have to change the game.
Read more about:
Featured BlogsAbout the Author(s)
You May Also Like


.jpeg?width=700&auto=webp&quality=80&disable=upscale)


