

Daily news, dev blogs, and stories from Game Developer straight to your inbox
Sponsored By
Featured Blog | This community-written post highlights the best of what the game industry has to offer. Read more like it on the Game Developer Blogs or learn how to Submit Your Own Blog Post
Beyond 50/50: Breaking Down The Percentage of Female Gamers by Genre
Using data from over 270,000 gamers, we’ve put together some findings on the percentage of female gamers across game genres.
10 Min Read

You’ve probably heard the often-quoted statistic that about half of video gamers are women, illustrating how gaming is now a mainstream activity enjoyed by both men and women. This finding comes from the yearly ESA report, and has fluctuated between 38% and 48% in the past decade—currently estimated at 41% in the 2016 report.
Oddly, this statistic can have the exact opposite intended effect. Some gamers argue that the study bundles gamers across platforms and genres, and is thus unrepresentative of the “real” PC/console gamers. Or that the apparent gender parity means there are no longer gender biases in game design. A game dev we recently chatted with mentioned that some designers she works with still assume that only 5% of core gamers are women, and that the quoted 41% of women are primarily casual gamers.
By bundling across platforms and genres, this 41% statistic doesn’t surface how the percentage of female gamers does or does not vary across genres, or how large that variance is. Using the data we've from over 270,000 gamers at Quantic Foundry, we’ve put together some findings on the percentage of female gamers across game genres based on the specific game titles they enjoy playing.
Data from the Gamer Motivation Profile
The Gamer Motivation Profile allows gamers to take a 5-minute survey to get a personalized report of their gaming motivations, and see how they compare with other gamers. Over 270,000 gamers worldwide have taken this survey. The 12 motivations that are measured in our model were identified via statistical analysis of how gaming motivations cluster together.
Alongside gaming motivations, we also collect data on demographic variables. In our full sample, 18.5% are female gamers. We also ask gamers to list specific game titles/franchises that they enjoy playing (up to 9). By sampling gamers who mention a specific game title/franchise, we can generate a profile of that game’s engaged audience. Note the data we have is limited to the favorite games listed by a gamer–they are likely playing more games than they are able to list, but this constraint holds true for all respondents in our data, whether male or female.
The Genres We Analyzed
Game genres are incredibly messy things. They evolve and overlap and hybridize over time. In many well-established genres, subgenres are common. This means that asking gamers to respond to genre labels yields messy data.
We decided to take an approach based on specific game titles. In our analysis, we manually picked popular game exemplars to create genre groupings. For each game, we calculated the proportion of its gamers that are female. And then we calculated the genre group average. So for example, when we say High Fantasy MMOs, we specifically mean the group average of gamers who enjoy playing World of Warcraft, Rift, Lord of the Rings Online, EverQuest II, and The Elder Scrolls Online.
Each genre we analyzed contained between 3-5 game titles. The median sample size for each game title was 1,184. And the median sample size for each genre was 4,657.
Action Adventure: Uncharted (series), Infamous (series), Metal Gear Solid V: The Phantom Pain, Rise of the Tomb Raider.
Action RPG: Diablo III, Dark Souls III, Torchlight (series).
Atmospheric Exploration: Journey, ABZU, Gone Home, Dear Esther.
Casual Puzzle: Angry Birds, 2048, Cut The Rope.
City Building: Cities:Skylines, SimCity (series), Tropico (series).
First-Person Shooter: Call of Duty: Black Ops III, Battlefield 4, Halo 5: Guardians, Counter-Strike: Global Offensive, Team Fortress 2.
Grand Strategy: Europa Universalis IV, Crusader Kings II, Stellaris.
Interactive Drama: The Walking Dead (series), The Wolf Among Us, Tales From the Borderlands.
Japanese RPG: Fire Emblem Fates, Bravely Default (series), Tales of Zestiria, Pokemon Sun and Moon.
Family/Farm Sim: The Sims (series), Harvest Moon (series), Animal Crossing (series), Story of Seasons, Stardew Valley.
Match 3: Candy Crush Saga, Bejeweled (series), Farm Heroes Saga.
MMOs (High Fantasy): World of Warcraft, Rift, Lord of the Rings Online, EverQuest II, The Elder Scrolls Online.
MMOs (Sci-Fi): Star Trek Online, EVE Online, Star Wars: The Old Republic.
MOBA: League of Legends, Heroes of the Storm, DoTA 2, StarCraft II.
Open World: Assassin’s Creed Syndicate, Watch Dogs, Far Cry 4, Grand Theft Auto V, Batman: Arkham Knight.
Platformer: Ori and the Blind Forest, Rayman Legends, Super Mario (series).
Racing: Need For Speed (series), Gran Turismo (series), Forza (series).
Sandbox: Minecraft, Terraria, Dwarf Fortress.
Sports: FIFA (series), NBA 2K (series), Madden NFL (series).
Survival Roguelike: Darkest Dungeon, FTL: Faster Than Light, Don’t Starve.
Tactical Shooter: Squad, ARMA 3, Tom Clancy’s Rainbow Six Seige.
Turn-Based Strategy: Civilization V, XCOM 2, Endless Legend.
Western RPG: Mass Effect 3, Dragon Age: Inquisition, The Witcher 3: Wild Hunt, Fallout 4, The Elder Scrolls: Skyrim.
Genre Averages of Female Gamers Range From 2% to Almost 70%
Here’s a chart of all the genre group averages in descending order. The percentages listed refer to the proportion of gamers within each genre that are female. So for example, the 69% for Match 3 games means that of the gamers who mentioned a Match 3 game in the data, 69% of them were female. The 69% does NOT mean that 69% of women play Match 3 games.
It bears pointing out that most gamers play a variety of games across genres, and a high participation rate in the chart doesn’t mean that gamers (whether male or female) only play that genre.
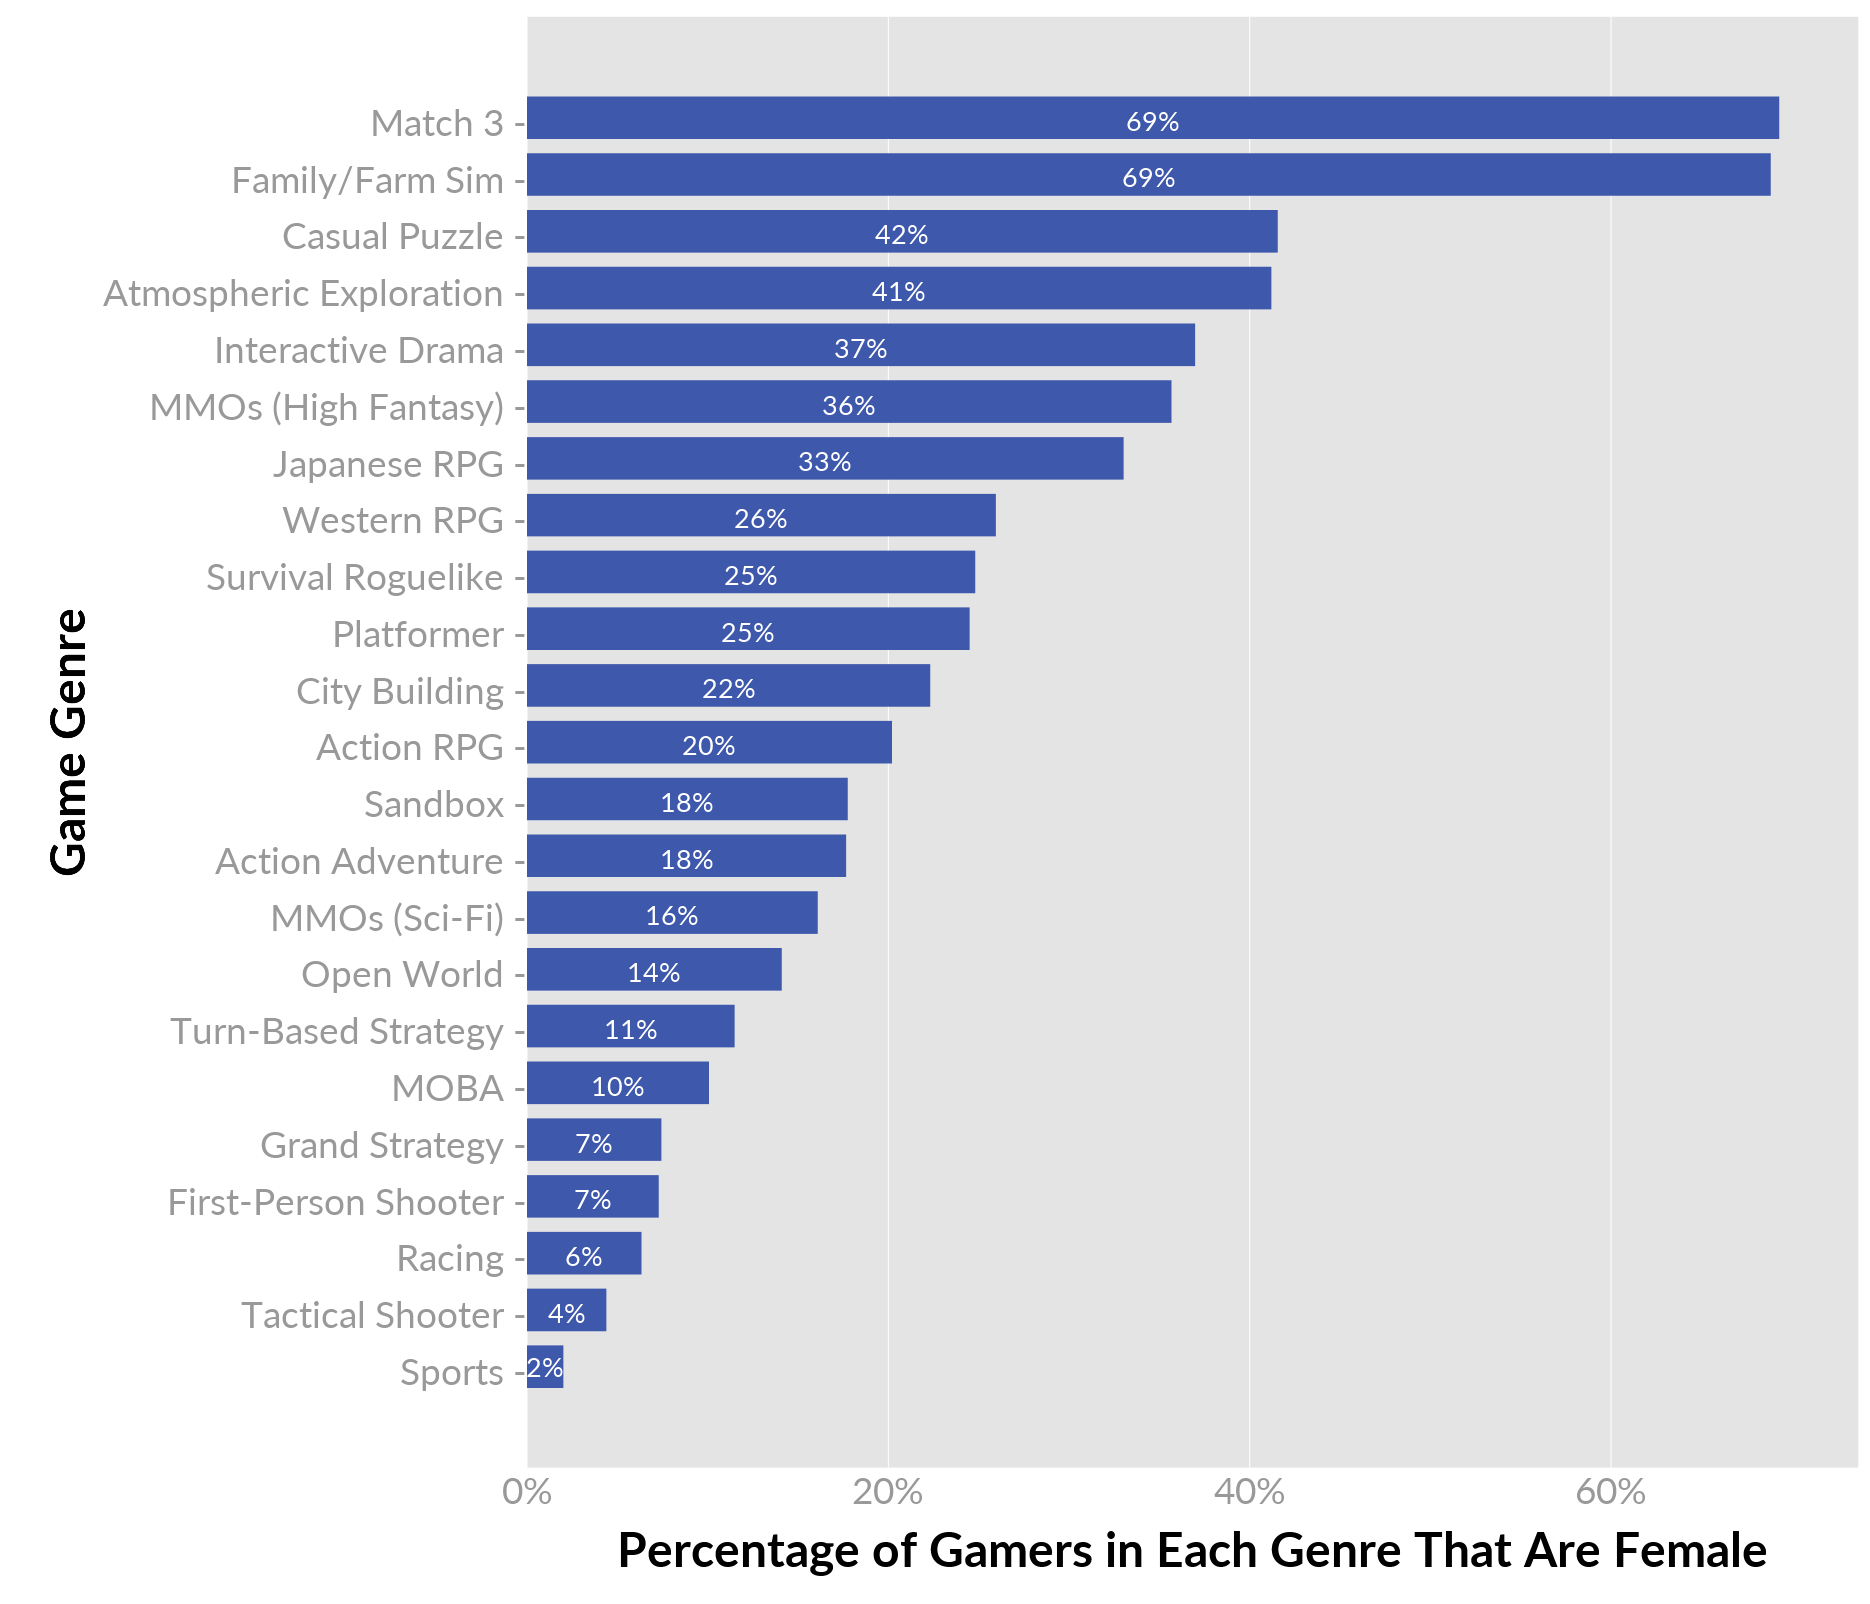
1) Match 3 Games and Family/Farm Sims Have the Most Female Gamers.
In fact, these two genres are head and shoulders above any other genre in terms of percentage of female gamers. The next highest genre is a full 27 percentage points lower in female gamers.
2) Tactical Shooters and Sports Games Have the Fewest Female Gamers.
Sports Games (with an average 2% of female gamers) have the fewest female gamers of all the genres we analyzed. Although the percentage of women in both Shooter categories is low, there are noticeably fewer women in Tactical Shooters compared with First-Person Shooters (4.3% vs. 7.2%).
3) The Variance in Female Gamer Percentage Across Genres is Large.
The genre averages range from 2% to almost 70%. This is a 35-fold difference, and illustrates why an overall statistic for all gamers (ignoring genre) can be misleading and confusing.
4) World of Warcraft is an Outlier Among High Fantasy MMOs.
23% of World of Warcraft gamers are women. This is substantially lower than the group average (36%). A lot of game researchers (Nic and I included) focused on studying WoW as an exemplar of online gaming, but it looks like WoW was not only an outlier in terms of market success, but also in terms of its demographics relative to other games in the genre.
5) High Fantasy MMO > Sci-Fi MMO
As we assembled the original MMO genre, we noticed a difference between High Fantasy and Sci-Fi MMOs, and decided to split the genre. This highlights the gender disparity in appeal based purely on thematic elements. High Fantasy MMOs have more than twice the percentage of female gamers compared with Sci-Fi gamers (36% vs. 16%).
6) Star Wars: The Old Republic is Skewing the Genre High.
SWTOR has almost double the genre average of female gamers (29% vs. 16%). Without SWTOR, the genre average would be 11.3%, at which point the group average for High Fantasy MMOs would be more than 3 times higher than Sci-Fi MMOs.
7) Assassin’s Creed and Dragon Age are Also Notable Outliers.
Among Open World games, Assassin’s Creed Syndicate is noticeably higher than the genre average (27% vs. 14%). And among Western RPGs, Dragon Age: Inquisition is also much higher than the group average (48% vs. 26%).
8) Genre Findings Align with Primary Motivation Differences.
In a previous blog post, we compared the primary motivations of male vs. female gamers. Much of those differences seem to underlie the current genre findings. For example, genres with more women emphasize Completion and Fantasy (the top 2 motivations for women). And genres for men emphasize Competition and Destruction (the top 2 motivations for men).
9) Highest Percentage of Non-Binary Gender Gamers in Exploration and Family/Farm Sims.
The baseline of non-binary gender gamers in our full sample is 1.1%. In the current analysis, the genres that had the most non-binary gender gamers were Atmospheric Exploration (3.8%), Family/Farm Sim (3.2%), Casual Puzzle (2.7%), and Sandbox games (2.3%).
The Opportunity Space is Larger Than It Appears
The data hints at how none of these numbers are set in stone or represent some kind of hard ceiling. Note that variations within the same genre can be much larger than variations between genres. For example, Dragon Age: Inquisition has double the genre average (48% vs. 26%). In fact, this 48% is higher than the next 5 genre averages. This means that the opportunity to attract female gamers may be a lot larger than what the chart is showing, especially if you’re the first ones to figure it out in your genre.
It’s also easy to read the genres in the chart and pin the cause solely on gender differences in gaming motivations–e.g., women simply don’t like X or Y game mechanic, but there may be a lot more going on. For example, games on the bottom of the chart tend to not have female protagonists, tend to involve playing with strangers online, and tend to have a lot of rapid 3D movement which can lead to motion sickness (which women are more susceptible to). Low female gamer participation in certain genres may be a historical artifact of how motivations and presentation have been bundled together and marketed.
As we saw in our analysis of Idle Clicker games, established genres are ripe for deconstruction in potentially fruitful ways. The most important takeaway is not to conflate what the numbers currently show with what the numbers could be.
Some Notes on Methodology
Disparity Between 41% Women in ESA Report Vs. 18.5% In Our Data
The delta between the ESA’s estimated 41% female gamers and our 18.5% is important, but how it impacts the data depends on your interpretation of the cause of that delta. The ESA randomly sampled and dialed up US households, but they don’t provide the details on who got counted as a gamer–e.g., if playing Solitaire last year counts.
What we do know is their sample has a large proportion of casual gamers. In their 2015 report, their most frequent gamers are most likely to be playing social games (31%) and puzzle games (30%). Note that this is their “most frequent” gamers. We can assume that their less frequent gamers are even more likely to play casual titles. So a large portion of their sample may not regularly play AAA titles at all.
Our sample is biased towards core gamers–people who would click on something labeled a Gamer Motivation Profile. But when we’re drilling down to a specific game (like Diablo III in the Action RPG genre), the 41% in the ESA sample is not a meaningful benchmark because a large portion of that sample was likely not playing a AAA game to begin with.
Limitations of Self-Selected Sample
The self-selected sampling is very much a limitation of the methodology, so we do try to make it clear how we collected the data to allow readers to interpret the findings in the proper context.
There are a lot of seemingly basic questions in gaming that we don’t have data for. For example, it’s strange that we don’t know the gender base rates of AAA genres. This is a reflection of how hard it is to sample gamers. So a big part behind our decision to publish this data was to start this conversation–“Here’s our methods. Here’s the data we found. It’s not perfect, but there’s very little data on this out there.”
As we overlay multiple sources, we’ll get a better sense of what is consistent and what isn’t. So for example, even though the ESA estimates 41% female gamers and we see 18.5% in our sample (with the bias towards core gamers), the underlying findings are consistent–the game genres that the most frequent gamers in the ESA report are playing are exactly the game genres we find have the highest % of female gamers.
We can also spot-check where data is available. For example, Tekken has published a 23% female gamer estimate, and it is 21% in our data. League of Legends published 10% 4 years ago, and it is 14% in our data.
Read more about:
Featured BlogsAbout the Author(s)
You May Also Like


.jpeg?width=700&auto=webp&quality=80&disable=upscale)


