
Trending
Opinion: How will Project 2025 impact game developers?
The Heritage Foundation's manifesto for the possible next administration could do great harm to many, including large portions of the game development community.
In this Intel-sponsored feature, part of the Visual Computing subsite, Ghostbusters game creators Terminal Reality discuss using Intel Graphics Performance Analyzers to optimize the rendering and effects for the PC version of the game

[In this Intel-sponsored feature, part of the Visual Computing subsite, Ghostbusters game creators Terminal Reality discuss using Intel Graphics Performance Analyzers to optimize the rendering and effects for the PC version of the game.]
Admit it. For the past 25 years, you ain't been afraid of no ghosts. Thanks to a certain movie about four intrepid heroes, we all know a well-aimed proton stream and a handy trap can bag any ghoul within range. The venerable Ghostbusters franchise has spun out at least eight different video games since 1984, each taking advantage of the movie's supernatural feel and sci-fi effects. The newest version Ghostbusters: The Video Game has received good reviews since its release earlier in 2009, thanks in no small part to its updated effects.
As Mark Randel, president and chief technology officer of Terminal Reality, Inc. described it in his blog at http://software.intel.com/en-us/blogs/author/mark-randel/, "The results of having a massively parallel game engine were stunning. When we finally got rendering and simulation of the game in parallel in the last weeks of Ghostbusters, the game became solely render-bound. Jobs were totally asynchronous, and we were able to fully utilize three to four cores. When there wasn't any action in the game, the game was waiting on the vertical blank. With a lot of action, the job model allowed the heavy lifting to be absorbed over as many processors as the system had."
The game is published by Atari, who wanted a great mainstream game to reach the largest possible target market. Atari pushed the team to make sure the game was optimized for integrated graphics systems, in order to maximize their investment and ensure good performance.
The developers at Terminal Velocity took extensive advantage of Intel Graphics Performance Analyzers (Intel GPA) and their membership in the Intel Software Partner Program to bring out the best special effects required to chase down vapors, slimers, and poltergeists. Intel's tools helped identify a performance bottleneck so the game could be optimized for desktops and laptops that use Intel Graphics processors. And once performance problems are solved for the Intel Graphics world, they are essentially solved for the rest of the graphics universe.
Thanks to fine-tuning for multi-core and extensive testing for bottlenecks, Ghostbusters: The Video Game really shines, especially on the newest Intel-based systems. What follows is a step-by-step analysis performed on an exceptionally low-performing scene in Ghostbusters: The Video Game by a team consisting of both Intel and Terminal Reality developers. The team's comprehensive work is a model for anyone who wants to troubleshoot similar game-performance issues.
Jeff LaFlam and Shankar Swamy, application engineers with the Intel Visual Computing Enabling Team, worked with Mark Randel, president and chief technology officer of Terminal Reality, Inc., to detect and analyze a serious bottleneck in a specific scene in Ghostbusters. This scene was running so slowly, and with a barely acceptable frame rate, that the game play was visually stuttering. This scene had stymied progress in optimizing the game's overall performance.

The troublesome scene contains about 200,000 books in a library where two human characters and a "ghost" character might interact. When the characters are fully outside the library they cannot see the books; hence, there is no need for the game to render the books. However, as a character enters the library, the books are gradually exposed to the viewer and displayed in the game play scene. The team of LaFlam, Swamy, and Randel analyzed this scene to determine solutions for increasing the frame rate.
The team of LaFlam, Swamy, and Randel analyzed this scene to determine solutions for increasing the frame rate.
Step 1: Visually Analyze the Scene
The team began by visually analyzing the entire scene sequence in order to determine a direction for further investigation.
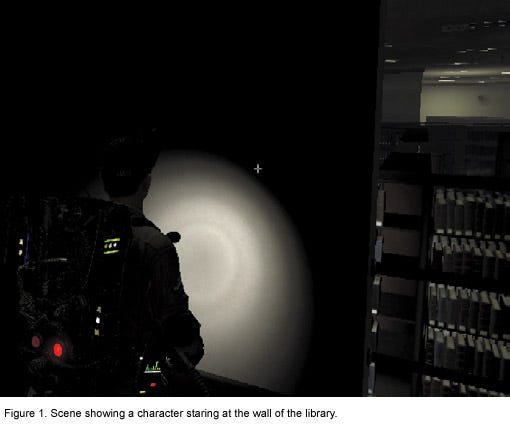
The team observed that when a character was staring at the wall and the books were partially exposed, the frame rate was very low and the scene stuttered (Fig. 1). When they then advanced the scene and moved a character closer to the wall but with no books visible in the scene, the frame rate did not change noticeably. This indicated to the team that the books were being rendered in the scene even when they were not visible.
Step 2: Render with Z-Test Disabled
The goal of the second step in the analysis was to determine how many occluded objects were being rendered in the library scene. This was done by rendering all the objects in the scene with the Z-test disabled.
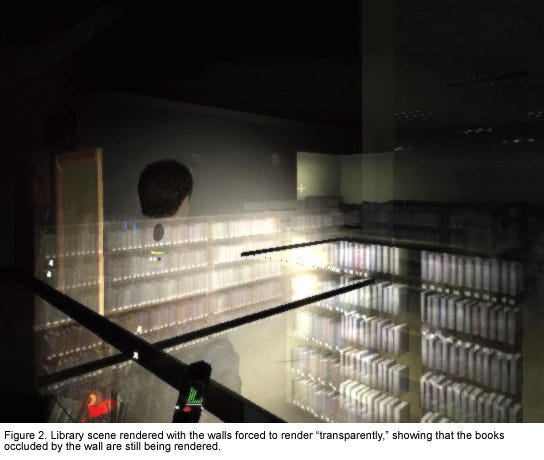
In Figure 2, notice that the character is standing very close to the wall and staring directly at it. Prior to optimizing this scene, during normal game play (with the Z-test enabled), the books shown would not be visible because of the direction the character is looking. However, because the team disabled the Z-test for Figure 2, all the books being rendered by the game are also now visible.
This confirmed that books are being rendered all the time-even when they are completely occluded during normal game play. Of course, only the books that are visible to the characters at any point in the game play need to be rendered.
Step 3: Conduct a Single-Frame Analysis
The team wanted to investigate other possible hot spots in the scene by using the Intel GPA Frame Analyzer.
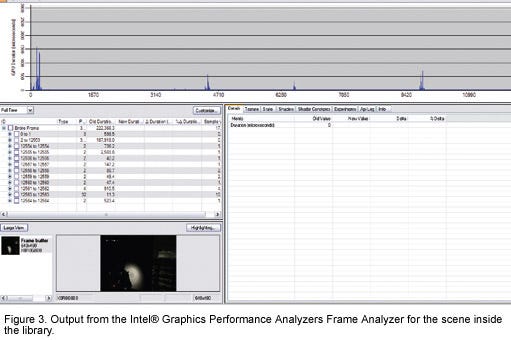
According to the Intel GPA Frame Analyzer, the Library scene had 12,564 Draw() calls (Fig. 3). However, other scenes in the game typically had about 3,000 Draw() calls, and those scenes had higher frame rates. The conclusion was that there were too many Draw() calls in the Library scene, indicating to the team that further testing should be aimed at reducing the number of Draw() calls in the troublesome scene. The team also wanted to investigate how many of these calls were coming from the rendering of the books.
Step 4: Estimate the Cost of Rendering the Books
The team placed the camera in front of a wall that had no objects behind it. Because this is a third-person view game, the characters in the Library scene are still rendered-as they should be. However, the books, which are now behind the camera, are invisible and should not be submitted for rendering due to the game's culling algorithm.
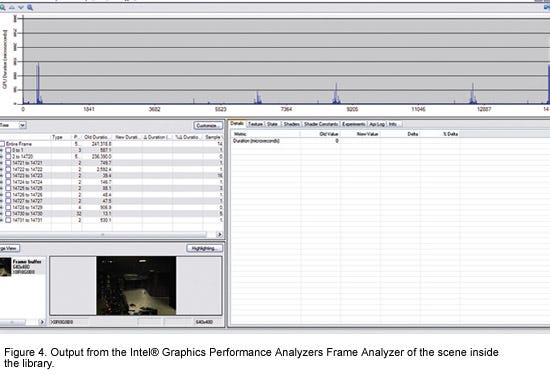
The team wanted a reliable estimate of the cost of rendering the books. By submitting the scene to the Intel GPA Frame Analyzer (Fig.4), the team discovered the scene had 14,731 Draw() calls, confirming that the books were quite expensive to render. In fact, the overhead of rendering the books is significant enough that it negatively affected the frame rate when the books were occluded yet still rendered.
Step 5: Verify the Potential Gains
Next, the team included a software switch in the graphical user interface (GUI) that allowed them to completely turn off rendering for all the books (whether visible or occluded). They then rendered the scene by dynamically turning this switch on and off, allowing them to determine the change in frame rate when books were rendered versus when they weren't.
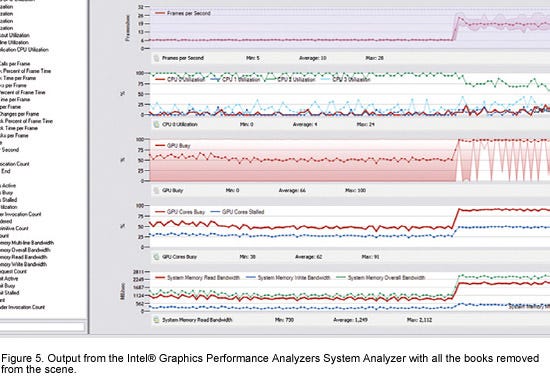
When book rendering was turned off, the frame rate increased by approximately 2.5 times, as shown by the data from the Intel GPA System Analyzer within the red oval in Figure 5. This indicated that the cost of rendering the books in the scene was quite high.
At this point in the analysis, the obvious options for increasing the performance of this scene were either:
Don't render the books that aren't visible in the scene, or
Reduce the number of books in the scene.
Step 6: A Third Solution is Created
When the Intel team shared their findings with the developers at Terminal Reality, Mark Randel suggested-and implemented-a third solution: a "pixel height test."
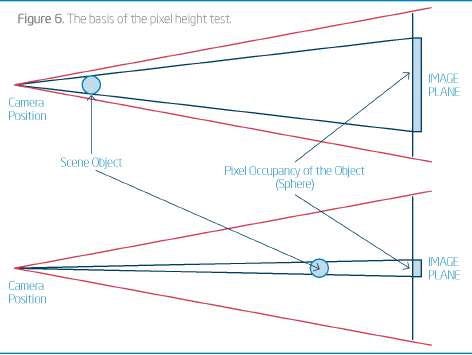
Figure 6 shows the idea behind the pixel height test. The bounding sphere of an object is shown as circles in Figure 6 and indicates the pixel coverage on the screen required for that object either when the object is close to the camera or when it is farther away.
Using the pixel height test on the objects in a scene, the test can determine which objects contribute less than one full pixel to the displayed frame. To approximate the pixel coverage, the test determines the object height in screen space in pixels. This testing code is executed on the processor. As a result of the pixel height test, if the pixel height of an object is less than a pixel, the object is not submitted for rendering.
In the troublesome Library scene, the fact that the objects (books) all had identical dimensions-because they are instantiations of a single object-made the test easier and faster to run because the bounding spheres for all tested objects (books) were identical.
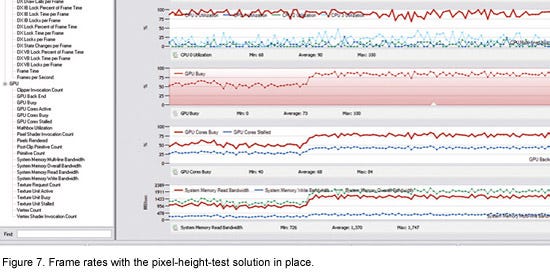
Step 7: The Results of the Pixel Height Test
Figure 7 shows the result of implementing the pixel height test on the Library scene in Ghostbusters. Using the software switch created by Randel, developers were able to turn the test on and off. When the pixel height test is running, objects (books) that are less than one pixel in height in the scene, are not rendered. As shown by the data in the green oval in Figure 7, where the test was turned on, the frame rate of this scene doubled when the books less than one pixel in height were not rendered.
The data in Figure 7 also shows that the overall usage of the graphics resources went up, with the test indicating that the game was now using resources more optimally.
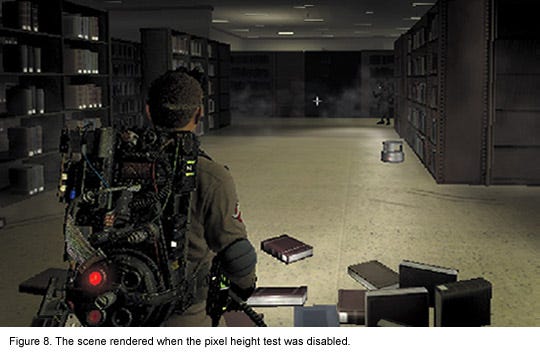
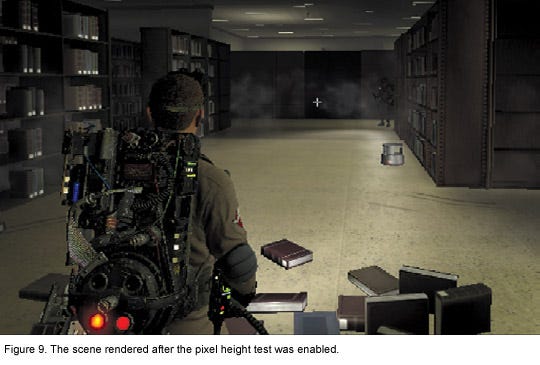
Figures 8 and 9 are the screen captures of the scene before and after the test was enabled. There is no visual difference between the two renderings, because no visible object was affected by the change.
When the team first started this analysis, the scene was rendering so slowly that it was considered the major issue preventing the game from being highly playable. Based on a thorough analysis and the implementation of the pixel height test that followed, the scene ended up rendering at double the original frame rate. Other scenes in the game enjoy even higher frame rates.
As good as the Intel GPA tool was for the development of the latest Ghostbusters game, several new features have been added subsequent to that project. Randel reports that he is finally enjoying a little downtime after working since 2006 on Ghostbusters, but he's already looking forward to the next project. "It will be really nice to have the new Intel GPA tools," he said recently. "There are still a few more things we can do to add those key details to a highly believable, fully destructible environment."
Here are some of the key new features that have been added to the Intel GPA to make it even easier to find and quickly address performance issues in games, as well as debug rendering problems:
Pixel History
Pixel history is a great new feature in Intel GPA that provides a wealth of information on any pixel in any render target. A zoom feature (using the mouse wheel) was also added for a more exact selection of a particular pixel of interest. To select a pixel, simply left-click a pixel in any render target. After a pixel is selected, the history of all GPU operations (draw calls, clears, and so on) that affected that pixel is displayed in the pixel history tab, which is automatically opened. This lets you see exactly which draw calls affected that pixel location for the render target from which it was selected. For each draw call in the list, the number of times the pixel was touched and the final pixel color are also displayed. If the pixel was rejected, for example if Z-test was enabled, the reason for the rejection is noted as well.
Pixel history enables two key use cases: visual debug and overdraw analysis. The visual debug workflow allows you to diagnose why a pixel was rendered incorrectly. It also shows which draw call in the history caused the selected pixel to be the color that it is. The overdraw analysis workflow depicts how much overdraw exists at any pixel location and specifically which draw calls contribute to it.
Overdraw Visualization per Render Target
The Intel GPA render target viewer has a new overdraw visualization mode. When enabled, each render target is visualized in gray scale. Overdraw corresponds to lighter pixels in the gray-scale visualization. By enabling this mode, you can immediately see which portions of the render target are being written to most often.
Intel GPA also allows you to combine the usage of both pixel history and overdraw visualization. This allows you to seamlessly find overdraw hotspots with the visualization and then immediately select any of the hot pixels to understand which draw calls are contributing to overdraw at that location.
Vertex Shader and Pixel Shader Durations
Shader durations are now enabled as metrics for all DirectX devices. These metrics are available in three places: the bar chart graph at the top of the user interface, the scene overview spreadsheet view on the left, and the details tab on the right.
With the bar chart, you can now select any metric in the x- and y-axis. For example, you can configure vertex shader duration in the x-axis and pixel shader duration in the y-axis. By looking at the shape of each rectangle in the bar chart you now can compare two metrics at the same time. Within the scene overview, you can view these new metrics in spreadsheet form by clicking the Customize button, and then selecting any metrics of your choice. Finally, the details tab always lists all possible metrics and enables you to view their values summed across the current draw call selection set.
Single Step Frame
Intel GPA has a new single step feature that enables better control over the frame to be captured and analyzed. When using the System Analyzer, simply press the pause button to pause the game in real time, then press the single step button as many times as needed to reach a frame of interest. The capture button can be pressed at any time.
In-Game Hot Key
The new hot-key feature allows easy frame captures on a single computer while playing the game. Simply launch the game using Intel GPA, run it full screen, and then press CTRL+SHIFT+C (or configure any keys you want to use) for each frame you want to capture. When you are ready to analyze, close the game, and then open the Frame Analyzer on the same computer or a remote system for analysis.
Export Metrics to a CSV File
With CSV (comma separated value) file export, detailed frame performance data can be saved and later pulled into Microsoft Excel or any other program that can process CSV files. This feature allows you to track game performance changes over time, compare game performance with various game options enabled, or even compare game performance on various graphics cards-all at a per-draw level of detail.
Because this feature is draw call selection set-based, you can select the draw calls you are interested in (or the whole frame) and export only those calls, so you don't have to wade through large amounts of data to find the details you want.
Intel GPA tools help game developers make sure that performance issues don't detract from a game's entertainment value. Developers can run code experiments that measure and report performance results in real time. Intel GPA provides open, accessible libraries that can both customize tools for specific needs and pull data for deeper analysis. Better use of screen real estate avoids the intrusive display overlay of other interfaces, and the ability to share captured frames with team members increases the efficiency of optimization.
Thanks to the Intel GPA tools, developers can learn more about what's going on "behind the curtain" on their games. The new features take an already strong engineering toolset and turn it into a formidable asset manager.
Thanks to interaction with game developers around the world, Intel continues to fine-tune these tools. Priced at USD 299, the Intel GPA tools are free to anyone willing to take the time to fully register. Go to www.intel.com/software/gpa and grab the tools and the documentation, read the case studies and white papers, and get involved in the developer forums. Your game's performance-and fun factor-are at stake.
Read more about:
FeaturesYou May Also Like