Daily news, dev blogs, and stories from Game Developer straight to your inbox
Sponsored By
Working time among video game developers: Trends over 2004-14
A decade of research into the amount of time developers really work, culled from surveys given to game developers and crunched by academics who know the subject intimately.
October 23, 2015
16 Min Read

Author: by Marie-Josée Legault, Johanna Weststar
This feature contains a decade's worth of information on how long developers really work -- culled from surveys given to game developers and interviews with them.
The data was crunched by academics who know the subject well: Marie-Josée Legault, Professor in Labor Relations, Téluq-Université du Québec, and Johanna Weststar, Assistant Professor, Management and Organizational Studies Department, Western University.
The pair previously contributed "Are Game Developers Standing Up for Their Rights?", which also tackled quality of life issues, to Gamasutra in 2013.
Introduction
The video game industry is an object of unrelenting criticism about its working conditions and is often accused in social media of treating its developers poorly. According to the 2014 Developer Satisfaction Survey (DSS) survey of the International Game Developers Association (IGDA), 32 percent believe that there is a negative perception of the game industry. When asked why, working conditions was the top response (68 percent), just before sexism in games (67 percent) and perceived link to violence (62 percent) (Edwards, Weststar, Meloni, Pearce & Legault, 2014). Among those engaged in core game development roles this number rises to 77 percent (Weststar & Andrei-Gedja, 2015).
The labor issue of working time stands out among others that besmirch the industry’s image: discretionary rules in establishing wage levels, in appointing to projects, in attributing credits, insufficient intellectual property rules and funds for updating knowledge; lack of job security and arbitrary hiring and firing decision processes; non-disclosure and non-competition agreements that may end up in legal proceedings.
Long working hours have become an inescapable feature of the industry where developers are often bound by contracts that do not include any terms and conditions of employment relating to hours of work and normal working hours or any policy regarding overtime work and compensation.
Let’s account for the facts related to the evolution of working time among video game developers over the latest 15 years.
To do so we focus on game designers, interaction and level designers, programmers, 2D and 3D artists, audio artists, writers or narrative designers, localisation experts, etc. We are not including quality testers, managers, nor team leads.
Our discussion here is informed by the data collected in three IGDA surveys:
2004 Quality of Life (QoL) survey (1000 respondents);
2009 Quality of Life (QoL) survey (1145 respondents in the developers sub-sample);
2014 Developer Satisfaction Survey (DSS) (795 respondents in the developers sub-sample).
The IGDA is a non-profit membership organization of individual creators of video games. In 2004, the IGDA launched its initial Quality of Life (QoL) survey to gain a clearer understanding of some employment issues – from “crunch time” to compensation issues. In 2009 and 2014, the IGDA partnered with us to develop a new version of the Quality of Life survey and to process and analyse its results. This allows us to compare three milestones in the young life of this industry to take stock of the evolution in the international industry’s issue of working time.
As part of our research we have also conducted 147 interviews with developers in Montreal, Toronto and Vancouver. We have written a more complete report on the trends in working time that includes some discussion of this interview data as well as more survey data, additional detail about our methods and an account of the legal framework regarding overtime in the US and Canada.
A general decrease in regular hours of work
The IGDA surveys distinguished between two different targets in investigating regular hours of work among respondents: the hours developers are expected to work and the hours that they actually work.
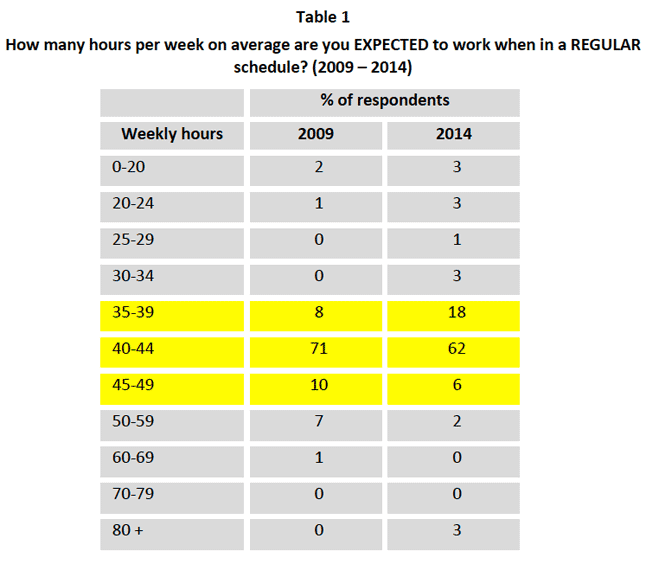
Hours management expects developers to work
First, we can observe the management’s expectations regarding the length of the regular work week, as perceived by respondents. This question was first asked in 2009 so we can now see how the situation has changed in 2014.
Table 1 shows an improvement in the respondents’ perceptions of managers’ expectations. In 2014, a larger share of respondents than in 2009 reported that their studio management expects them to work 35-39 hours per week when not in crunch time. This category is what we would consider ‘normal’ hours in a ‘standard’ work week. Fitting the same trend, compared to 2009, a smaller share of respondents in 2014 felt that their studio management team expects longer hours (between 40 and 49 hours a week) as a regular work week.
Hours developers actually work on regular days
In the long run we observe a general decrease of the regular working hours over 2004-2014. This means that there is an increase in the 35-44 hours bracket between 2004 and 2014 and a decrease in the longer duration categories.
In 2004, 40 percent reported working 44 hours or less per week. This increased dramatically to 59 percent in 2009 and increased again slightly in 2014 to 66 percent. Over the same time period fewer respondents reported working more than 45 hours per week: 61 percent in 2004, 41 percent in 2009 and 34 percent in 2014 (Table 2).
This data also indicates that the number of part-time employees in the industry might be rising since there is an increase in the number working less than 30-34 hours per week. As the game industry is not known as a sector where you can find part time employees, this requires deeper investigation.
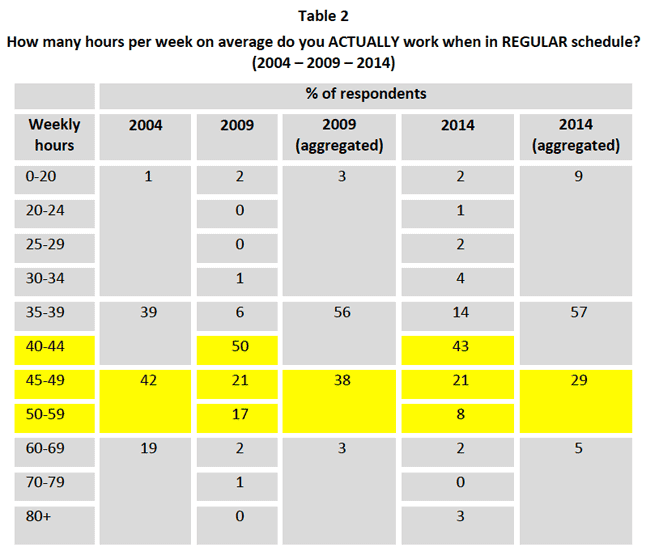
Note: We have arranged data here to take advantage of more detailed data in 2009 and 2014, and still manage to compare the outcomes of the three surveys.
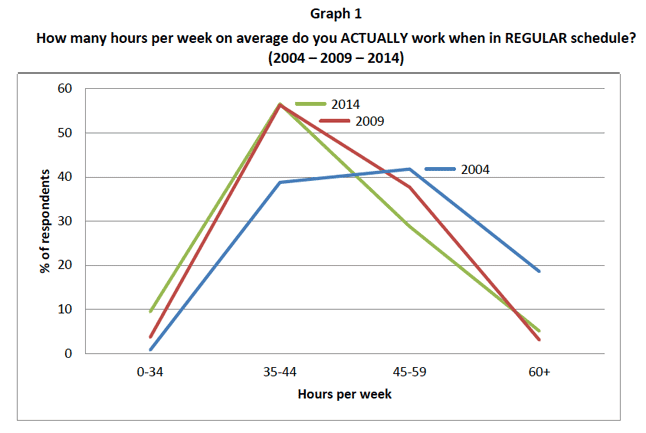
Graph 1 illustrates this reduction in actual hours of work in a regular schedule between 2004 and 2014. As discussed above, it highlights a greater concentration of respondents in the shorter durations in 2009 and 2014 when compared to 2004.
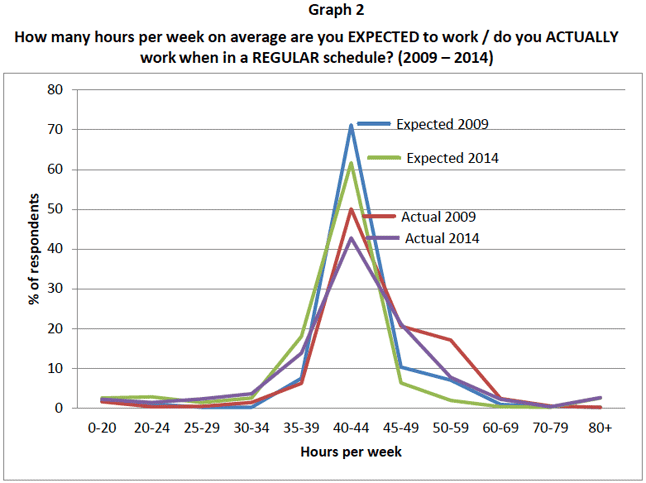
To take advantage of the more detailed data collected since 2009, we can also compare the expected hours of work to the actual hours of work. Graph 2 shows that the reduction in the hours of work between 2009 and 2014 has been both in terms of management expectations and actual hours worked. However this graph also shows that developers still tend to work more hours than they are officially expected, though this gap may be smaller in 2014.
A decreasing practice of crunch, but still important
Crunch time, a project management notion
For the purpose of the IGDA survey, crunch time was defined as when a team goes into an extended period of work (beyond the regular hours) to meet milestones and deadlines for shipping deliverables. Known as overtime to most people outside of the industry, the use of the word overtime is carefully avoided in the video game industry. Though the phenomenon itself is common to project based environments, the virtually exclusive use of the term crunch in place of overtime is characteristic of this industry.
Crunch time is a threefold notion, as workers can be asked to:
add working hours to the regular weekly working hours and the length of the work week varies between 45 and 90 hours;
extend this practice over a few weeks or a few months;
repeatedly engage in discrete periods of crunch over the course of a project or over a certain time period
To understand this multi-faceted nature of crunch, we then have to consider how many hours developers work in crunch, how long a period of crunch extends and how many times they crunch over some defined time period (i.e., over the course of a year). We also must acknowledge the variation in crunch practices across studios. In some studios crunch is standard practice, rather than the exception. In some others, it’s nearly banned.
The general practice is decreasing, but is still part and parcel of the trade
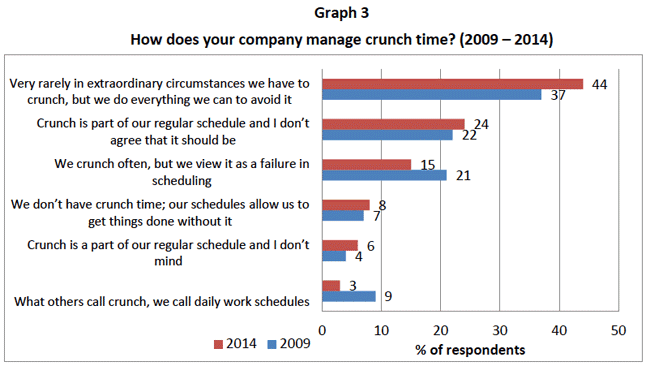
First, the 2009 and 2014 surveys asked a question that allows us to compare the studio practices related to crunch time. As Graph 3 shows, the share of respondents who said that their studios do all that they can to avoid crunch has increased from 37 to 44 percent.
If we combine the first two sets of answers on Graph 3, we get the proportion of respondents who consider the practice of crunch as an exception to the rule in their studio. This has increased from 44 percent to 52 percent over the five year span.
If we combine the last four answers, we get the proportion of respondents who perceive the practice of crunch to be part of the regular schedule of their studio. This has decreased from 56 percent to 48 percent.
These numbers are trending in the right direction, but a high proportion of developers still work at studios where crunch is common and even accepted.
The 2014 survey asked for the first time if respondents had experienced crunch time in the past 2 years. The data show that 21 percent of our respondents have not experienced crunch in 2014. Still, that means that three quarters of the respondents have experienced crunch in the last 2 years, which means it’s still part and parcel of the trade: 19 percent experienced crunch once, 19 percent twice, 42 percent more than twice (Legault & Weststar, 2015:15).
The next question (Graph 4) was also asked for the first time in 2014. Again, we must acknowledge that more than half of the sample considers crunch time as part and parcel of projects or video game development.
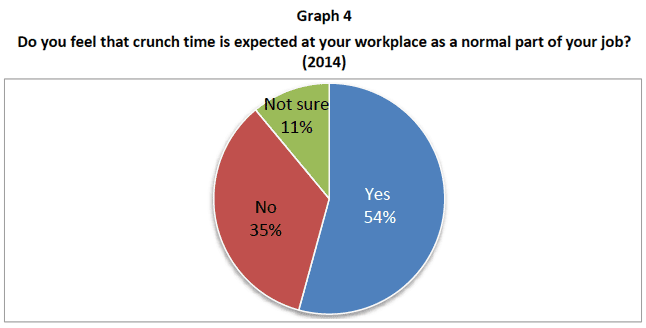
This gap between expected hours (the perceived managerial norm) and actual hours, contrasted with 21 percent of respondents reporting that they have not experienced crunch, raises the issue of the ability to take the “refusal stance”.
Is it possible to refuse to crunch?
At 21 percent, a high proportion of respondents said they have not experienced crunch, yet only 8 percent of respondents said that their studio does not have crunch time. How can this be? The difference is in the studio policy versus the experience of individual developers. Very likely, the majority of studios are practicing crunch all the same, but in a studio that practices crunch, workers on some projects, or some individual developers can avoid it or refuse it.
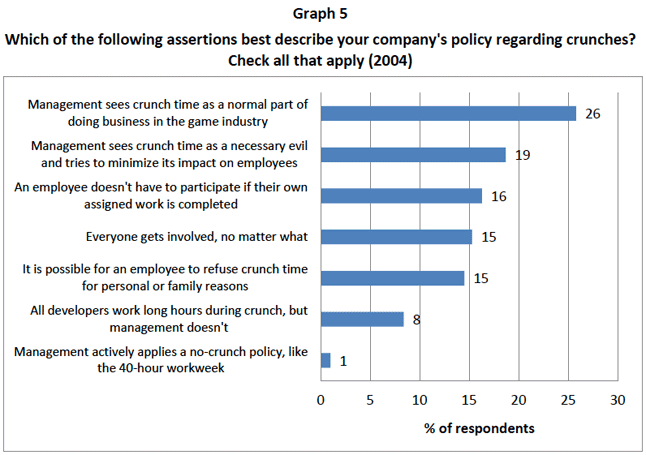
Indeed, as we saw above in Graph 3 (How does your company manage crunch time?), 44 percent of respondents said that they crunch very rarely and do everything they can to avoid it. In 2004 the question about company policy on crunch time presented different response options that were changed in subsequent years. These help us to further understand the ability to refuse crunch. As seen in Graph 5, some developers can avoid crunch time sometimes or generally if they are working in a studio that tries to avoid it, but also if they are exempted from it for individual reasons. We can also compare the last option in 2004 with the 2014 data regarding no crunch policies; 1 percent of the studios had an outright ban on crunch in 2004, while in 2014, 8 percent reported that their studios did not crunch.
So, despite a slight enhancement in the occurrence of crunch time in this data, it still is a regular practice in the bigger universe of project management and in the video game industry in particular. But, as we can see from looking at the other measurements of crunch below, though the practice may not be extinct, there is an evolution.
The hours management expects developers to work in crunch
As we discussed above regarding the hours of work in a regular schedule, we first observe the expectations of management as perceived by respondents. This question was not asked in 2004 so we can only compare perception of expected hours between 2009 and 2014.
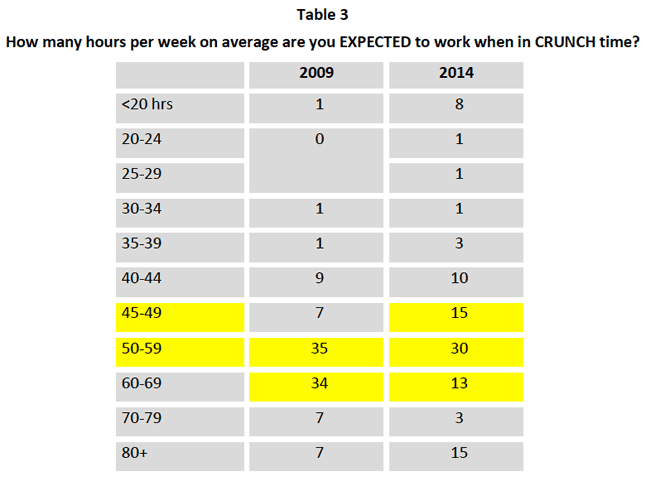
And here again, there is an improvement in terms of how much developers think they are expected to work. In 2014, a larger share of respondents than in 2009 reported that they are expected to work 45-49 hours per week while in crunch time. To mirror this, a smaller share of respondents reported that they are expected to work longer hours than that (i.e. 50-69 hours). Off-setting this downward trend, the percentage of respondents who felt that their management expected them to work very extreme hours of 80 or more per week doubled between 2009 and 2014 (Table 3).
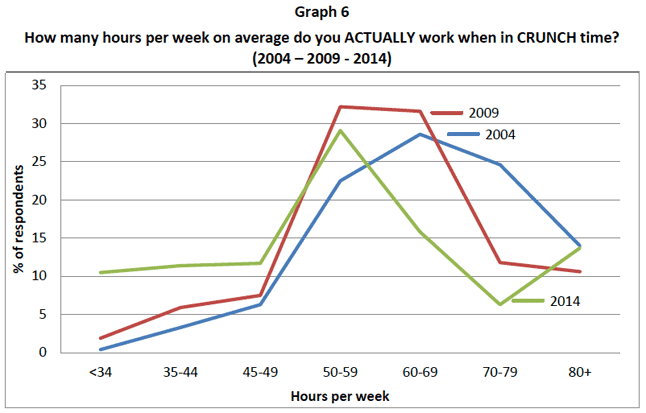
The hours developers actually work on crunch time
When we turn to the declared actual duration of the crunch time, the 2014 data show a more distributed set of frequencies and a trend towards fewer respondents working more than 60 hours a week while in crunch (67 percent in 2004, 54 percent in 2009, 36 percent in 2014) (Graph 6). Though clear, this trend is contradicted by a constant share of respondents working 80 hours and more. It is interesting to note that this spike in 2014 returns to 2004 levels. This shows that there is a constant hard core of studios practicing intense crunch.
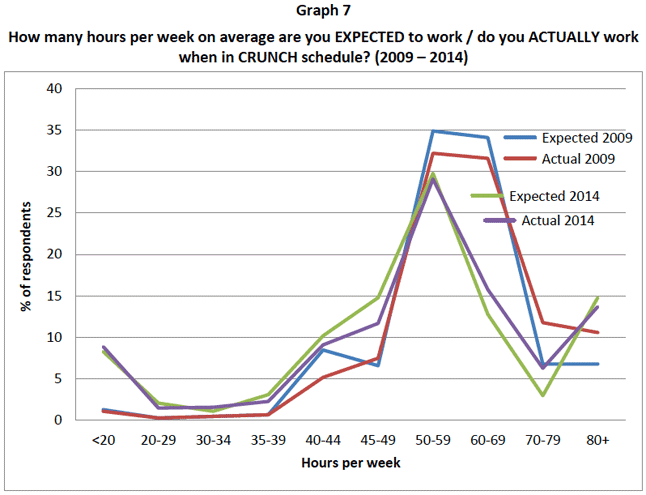
Again to mirror the approach for regular schedule hours above, Graph 7 below illustrates the decreasing trend in crunch time for both expected hours and actual hours over 2009-2014. This graph also allows a comparison between the two where we again see a slight tendency for developers to work more hours than they are officially or ostensibly expected to at the high ends of the spectrum.
Yearly weeks of crunch time on a downward trend
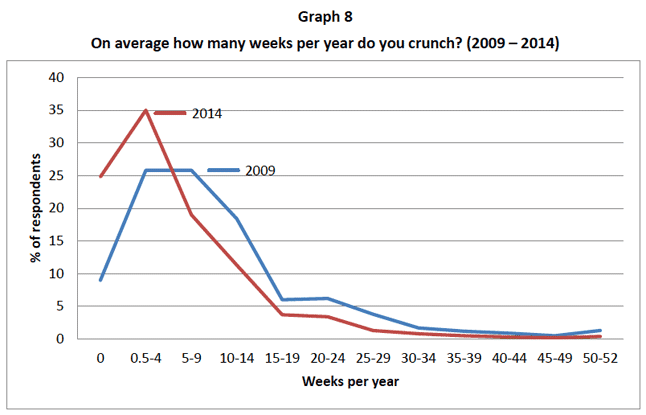
To have a better picture of the practice of crunch, we also have to account for the number of weeks in a year that developers are asked to work in crunch. The question of actual weeks working in crunch was not addressed in 2004, so we compare 2009 and 2014.
In line with the discussion above, we see first and foremost that there is a clear increase in studios that work without crunch time (0 weeks per year on Graph 8). Where 9 percent did not work in crunch at all in 2009, in 2014 it’s close to 25 percent.
As well, the data show that crunch time for fewer than 5 weeks in a year is more widespread, while 5-9 weeks/year is less frequent, as are all the longer durations.
In 2009, 70 percent of the respondents were working in crunch for fewer than 15 weeks a year. This figure increases to 79 percent if we include respondents who never crunch.
In 2014, 65 percent of the respondents were working in crunch for fewer than 15 weeks a year. Again, this figure rises to 90 percent if we include respondents who never crunch.
This suggests that there really is an improvement in yearly duration of crunch time and that working without crunch is possible. That said, cut another way, in 2009, 40 percent of respondents reported working 10 weeks of crunch per year. This dropped to 22 percent in 2014, but still represents a large group of developers. Despite the net progress, 10 weeks of crunch is 20 percent of the year, and can challenge health and other aspects of your life.
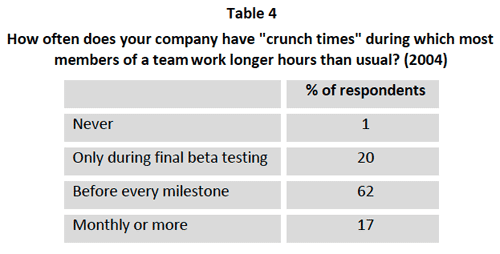
This question of how often the company has crunch times was asked in a very different way in 2004. Yet this data still serve to highlight the working conditions of video game developers in crunch, particularly as organized around project management scheduling principles that are very common in the industry. As shown in Table 4, 62 percent of respondents in 2004 were compelled to answer a call to crunch before every milestone. This helps to illustrate the common criticism about poor project management in the game making business.
Unfortunately, the “monthly or more” category is not commensurable with the other categories, and prevents us from knowing more about how often milestones are coming.
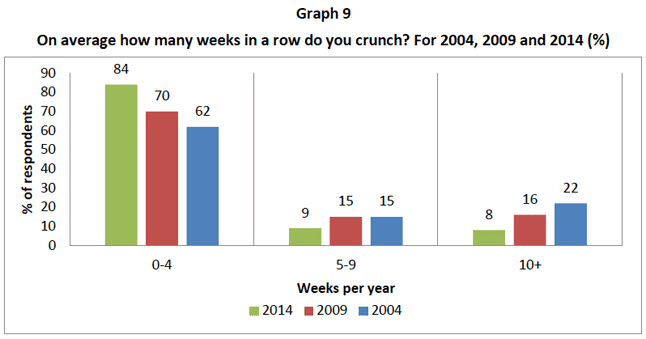
Weeks in a row of crunch time on a downward trend
Graph 9 shows the number of weeks in a row that developers are engaged in crunch hours. We see that as with other measures of crunch, this one also marks a downward trend. The percentage of respondents working in crunch for fewer than 10 weeks in a row increases from 78 percent in 2004 to 85 percent in 2009 and to 92 percent in 2014.
We can get more detailed data from the latter surveys; the 2004 survey did not provide options beyond 10+ weeks. For instance, in 2009, 79 percent of the respondents in 2009 were working in crunch for fewer than 15 weeks in in a row. More than 97 percent of the respondents were in the same situation in 2014.
All of this is good news, however, more than 2 weeks of crunch in a row is still a lot and can challenge health and other aspects of your life. Five weeks in a row is much worse. How many respondents are in this situation? Again a declining trend: 37 percent in 2004, 30 percent in 2009, 17 percent in 2014.
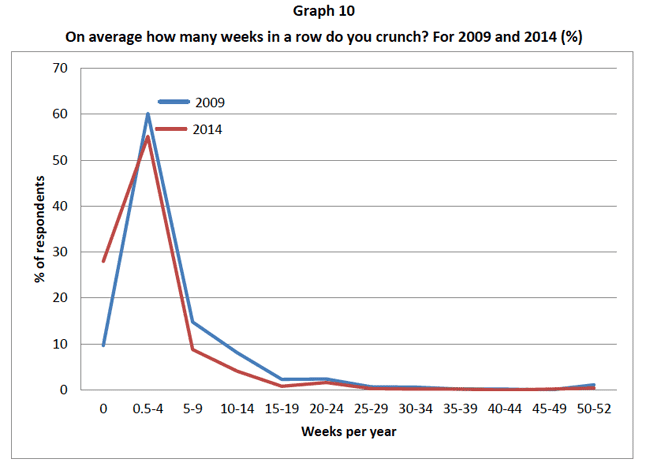
Graph 10 similarly illustrates the downward trend in the number of weeks in a row developers can be asked to crunch, taking advantage of the more detailed data collected since 2009.
Conclusion
Overall these trends are positive for the video game industry. Almost universally the survey data point to downward trends in working time and do much to raise hope about what has been such a problematic issue for the industry.
However, many individual experiences can be lost in generalized survey data and a good many developers are still working a whole lot of hours. Even on these pages, we can see that there is no real upward limit to working time for some respondents: Graph 5 shows that some respondents can work up to 80 hours a week during crunch time, though they form a reduced share of the population. Graph 8 shows that some respondents can work up to 40 weeks a year in crunch, though they also form a reduced share of the population. Finally, data not presented here (see the complete report) shows that some respondents can work up to 25 weeks years in a row in crunch, though they also form a reduced share of the population.
As well, ingrained studio practices of many game companies have yet to change with regards to crunch and the legal system (discussed in the complete report) enables managers to engage in poor practices. With this good news in hand, developers still too often fall prey to supposed industry norms and culture and commit themselves to a work environment that can rob them of their love of the game.
Additional Resources
All reports referenced here as well as a more comprehensive report on working time that includes additional survey data and interview data and can be found at: http://www.gameqol.org/igda-qol-survey/
You May Also Like


.jpeg?width=700&auto=webp&quality=80&disable=upscale)


