Daily news, dev blogs, and stories from Game Developer straight to your inbox
Sponsored By
Featured Blog | This community-written post highlights the best of what the game industry has to offer. Read more like it on the Game Developer Blogs.
How to Prioritize Features and User Stories
A development team's time can be wasted if they select the wrong user stories or features for a sprint or a release. In this article I will walk you through some proven operations research techniques to take the guesswork out of feature prioritization.
8 Min Read

A development team's time can be wasted if they select the wrong user stories or features for a sprint or a release. In this article I will walk you through some operations research techniques to take the guesswork out of user story and feature prioritization.
Operations research provides us with tools we can use to model problems mathematically to assist in making decisions. I'm going to show you how we can use multiple criteria decision analysis and project evaluation and review technique to determine the highest priority tasks to work on. These techniques may be overkill on a small project, but they are useful tools to have in your arsenal.
I have created a downloadable Google spreadsheet you can use to follow along or use as a template to perform your own analysis. Some of the math in this article might be intimidating, but don't be frightened. I have converted the mathematical formulas into spreadsheet formulas.
Estimating Value with MCDA
We don't need to know a monetary value - what we need is a number that represents the value of a feature relative to the other features in the product. All we need is way to represent value numerically. A feature with a value of 0.95 would be more valuable than a feature with a value of 0.05.
This can be modeled as a multiple-criteria decision analysis problem. We have multiple features competing to be incorporated in a release plan. MCDA provides us with tools that work well for estimating the relative value of the features on our product.
Some of these tools are pretty work intensive and you may want to look into decision support software if you're interested in them, but I don't think the minor increases in accuracy are usually worth the loss in efficiency. I'm only going to take a look at one of these that we can use for quick and dirty estimates: rank order centroids (ROC).
Estimating Value with ROC
Wikipedia doesn't provide the mathematical formulas related to rank order centroid, so I've included them here for the more mathematically minded producers. Don't panic if this doesn't make sense to you. I explain it below in plain English and set it up as two spreadsheet formulas.


The first thing we want to do is take the inverse of a feature's rank, which is simply 1/rank, or as I have entered as a formula in C2 and copied to the bottom of the spreadsheet:
=IFERROR(1/A2,"")
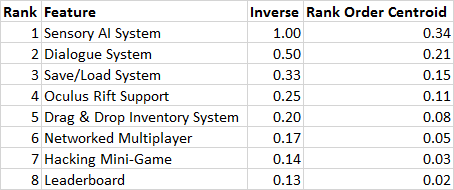
Next, we're going to take the sum of the current feature's inverse rank and sum it with all lower-ranked features' inverse ranks, and then divide that number by the total number of ranked features. I entered this as a formula in the Rank Order Centroid column and copied it to the bottom of the sheet:
=IF(ISNUMBER(A2),SUM(C2:C)/COUNT($A$2:A),"")
What this gives us is a rapidly decaying set of weights we can assign to each feature as a value that fairly accurately models how people weigh their priorities. Now that we have relative scores for each feature's value we'll move on to estimating effort.
Estimating Effort with PERT
The program evaluation and review technique (PERT) provides us with a useful formula for accounting for uncertainty in effort estimates that allows us to build in a little extra time on a task or feature. The formula is as follows:
Optimistic time (O): the minimum possible time required to accomplish a task, assuming everything proceeds better than is normally expected
Pessimistic time (P): the maximum possible time required to accomplish a task, assuming everything goes wrong (but excluding major catastrophes).
Most likely time (M): the best estimate of the time required to accomplish a task, assuming everything proceeds as normal.
Expected time (TE): the best estimate of the time required to accomplish a task, accounting for the fact that things don't always proceed as normal
 ÷ 6")
These weights are more of an art than a science. Dan Irish gives a slightly more pessimistic version of this formula in the Game Producer's Handbook.
 ÷ 6")
I've set up the spreadsheet with Dan's pessimistic version of the formula in the spreadsheet, but it should be easy enough for you to alter these weights as you see fit.
You'll gather these estimates from your development team as you decompose the features and user stories into tasks. The values in the sample spreadsheet are not from an actual product - I made them up.

Estimating Priority
Now that we have hour effort and value scores, we have all we need to estimate each feature's priority. What we're looking for is the fastest way to add value to a project, so a feature's or user story's priority relative to other features and user stories can be estimated mathematically as the feature's value divided by the amount of effort required to implement it. In other words, how much value we can add per hour.

We're going to pull our calculated estimates into a single table, sort them, and format them. We now have an ordered list of priorities for which tasks to work on first.

And there you have it - a quick and dirty prioritized list of features to include either in your next release plan or sprint plan. Let me know if this system works for you. If you have any questions or need any help using the template, let me know in the comments.
Read more about:
Featured BlogsAbout the Author(s)
You May Also Like
Latest News

Trending


Featured Blogs