

Daily news, dev blogs, and stories from Game Developer straight to your inbox
Sponsored By
Breaking down nearly 50 years of video game revenue
In a recent story, Bloomberg shared data from the analyst Pelham Smithers that tracks video game revenue across the last 50 years or so, broken down by platform.
2 Min Read

In a recent story, Bloomberg shared data from the analyst Pelham Smithers that tracks video game revenue across the last 50 years or so, broken down by platform.
That data starts with 1971, a $1 billion revenue year supported entirely by arcade machines, and runs all the way to 2018, a $138.5 billion year, before offering predictions on what Smithers says will be a shrinking market in 2019 and 2020.
The analysts’ full reasoning for why he predicts a downturn in the next two years is documented in the full story (and it’s a risky claim, by his own admission), but the year-to-year data on the sources industry revenue still makes for an interesting find.
For instance, revenue generated by game consoles has remained largely stable since 2003, ranging between $20 billion and $25 billion for the last 15 years (with the exception of 2018, a $27 billion year for consoles).
PC revenue has seen a gradual increase since first popping up in 1982, and landed at $35 billion in 2018 according to Smithers’ numbers. The same can’t be said for the handheld game market, which was seen its small share of yearly revenue decrease to only a sliver in recent years. In 2018, handhelds claimed only a 1 percent share, roughly $2 billion, of overall game industry revenue, down from a 24 percent, $16 billion peak in 2007. All of this is recorded in the graph below, though the version in the full Bloomberg story is interactive and offers some additional insight on each year's breakdown.
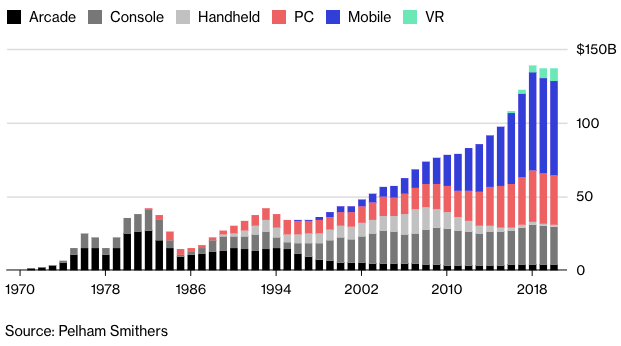
As pointed out by a user on ResetEra, the chart offers a look at when different sections of the industry peaked in terms of both revenue and overall market share. For instance, consoles claimed 40 percent of yearly revenue in both 1976 and 2000, while PC revenue has claimed 29 percent in its best years (1995, 2014, and 2015). Just in terms of revenue, consoles, PCs, and mobile hit new records in 2018 ($27 billion, $25 billion, and $67 billion respectively) while arcades hit their peak in 1982 with $27 billion and handhelds, as mentioned before, hit $16 billion in 2007.
Mobile, of course, has grown considerably in just the last few years and, according to Smithers’ numbers, was responsible for 48 percent of all game revenue in 2018. However, the analyst predicts that mobile will bring about a decrease in overall game revenue in 2019 and 2022, a fall he says is partially the result of China’s stricter game approval process and a coming Fortnite decline, and partially due to the console side of the industry struggling to follow up a record 2018.
About the Author(s)
You May Also Like


.jpeg?width=700&auto=webp&quality=80&disable=upscale)


