Daily news, dev blogs, and stories from Game Developer straight to your inbox
Sponsored By
Cleaning Memory and Partial Stalls in Your Code
Haim Barad discusses the pitfalls that you might run into if you're not careful about microarchitecture. In this article, with the help of mircorarchitecture expert Koby Gottlieb, he explains the concept of partial stalls and how they affects performance on modern dynamic execution microarchitectures, relevant to Pentium Pro, Pentium II, and Pentium III processors.
15 Min Read

This month, the Optimizations Corner gets "down and dirty" and starts examining many of the pitfalls that you might stumble into if you're not careful about microarchitecture. After all, a good way to slow down a fast computer is to write software that ignores the underlying microarchitecture. So, let's get those "glass jaws" in your code out of the way and let the raw speed of the machine shine through.
Koby Gottlieb is the Group Leader of the Media/VTune Group in Intel's Israel Design Center. Aside from being my supervisor (which explains the glowing remark I'm about to make), he's an expert in low-level code tuning for specific microarchitectures. In this article, he explains the concept of partial stalls and how it affects performance on modern dynamic execution microarchitectures, relevant to Pentium Pro, Pentium II, and Pentium III processors.
Maximize Your Application's Potential
Understanding the microarchitecture can help you develop high-performance applications for Intel architecture processors. Even though the application you developed for the Intel386 and Intel486 processors executes on the Pentium Pro, Pentium II, and Pentium III processors without requiring any code modification, optimization techniques combined with knowledge of the newest processor can help you tune your application to its greatest potential. In theory, a good compiler knows all about code generation strategy, but in practice, compilers are not perfect. In some cases the way we write our code forces the compiler to generate slow code, and in other cases the compiler is not as good as it could be. When writing assembly code we have no one to blame and therefore we should be aware of microarchitectural limitations. In this article I would like to highlight two aspects of performance problems: partial and MOB stalls.Detecting and fixing these problems in your code may help your application perform faster.
Understanding Partial Stalls
The Pentium II and Pentium III microarchitectures are based on dynamic data flow analysis. The processor decodes its instructions into simpler micro-ops that are called uops (internal units of work). These uops are added to the reorder buffer, and if all their resources are ready they are issued to the execution unit. The resource can be the result of another uop, or a real register or memory value. When more than one uop generates a resource, the processor cannot know from where to take the result of the resource, so it must wait for the value of the architectural register. The value only becomes available when the instructions generating the resource retire. For example:
mov al,mem1
mov ah,mem2
add bx,ax
The uop of the last instruction depends on the resources BX and AX. The value in register AX is generated by two uops, and therefore the last instruction can execute only after the first two instructions retire. So to formalize the problem, the instruction for which the partial stall is issued reads from a large register (for example, EAX) after a previous instruction writes to one of its partial registers (for example, AL, AH, AX). The read stalls until the write retires, even if the instructions are not adjacent. This stall applies to all register pairs involving a larger register with any of its sub-components. Examples of larger registers with one of its partial registers are AX with EAX, BL with BX, and SI with ESI. The stall does not occur if the write has already retired when the read begins execution.
A partial stall also occurs in the following cases because the processor operates on 32 bits internally (even though it seems to be operating on only 16 bits): A MOV instruction writes to any partial register, and subsequently the MOVSX (move with sign-extend) or MOVZX (move with zero-extend) instructions read from the same partial register. For example:
mov ax, 7
movsx ebx,ax
A MOV instruction writes to any partial register, and subsequently copies the contents to any segment register. For example:
mov ax, 7
mov ss, ax
The actual cycle loss for a partial stall varies depending on the number of cycles before the source instruction retires. The average cost is 7-10 cycles if the instruction uses the large register immediately after setting the small register. If more instructions are executed between this pair, the performance loss is smaller. If more than 40 uops are decoded between the setting of the small register and the usage of the large one we can be certain that the instruction that sets the register already retired, and a penalty is avoided.
The XOR and SUB instructions can be used to clear the upper bits of a large register before an instruction writes to one of its partial registers. When the upper bits of the larger register are cleared in this way, reading it after writing to one of its partial registers does not cause a stall. Other methods of clearing the upper bits of the large register do not prevent a stall.
Original | Optimized |
mov al, mem8 | xor eax, eax |
The INC instruction uses the entire EAX register. The preceding MOV instruction uses just the lower portion of the EAX register: AL. This causes a partial stall. Use the XOR instruction before reading the partial register to clear all bits in EAX and prevent the stall. If a mispredicted branch or interrupt occurs between the XOR and the setting of the small register the partial stall is not prevented.
Understanding MOB Stalls
The MOB (memory order buffer) is a memory subsystem that acts as a reservation station and a reorder buffer. It holds suspended loads and stores, and redispatches them when the blocking condition (dependency or resource) disappears. If an instruction needs to read a larger data element after a previous instruction wrote a smaller data element from the same address, the MOB cannot be used to forward the data. As a result the data must be loaded from memory instead of forwarding the value from the buffer.
The goal of the MOB is to prevent loads (LD) from being blocked by a store (ST) in the MOB. The idea is to allow store to forward data to load, instead of blocking the loads. Every load blocked by the MOB costs the Pentium II processor six to nine or more clocks. Stores are buffered in the MOB and are placed in memory in the background upon store instruction retirement (using spare cycles). All loads are checked against the previous store in the MOB to detect LD/ST conflicts so that memory ordering is maintained. Non-conflicting loads may pass stores.
A conflicting load (i.e. load to same address as a previous store) may receive its data directly from the store in the MOB, or it may be blocked until the store executes to memory. Certain conditions must be met for a store to forward data to load. In effect, this mechanism provides memory renaming. Store forwarding is a performance win. If a load is blocked (i.e., a conflict is detected but store cannot forward), there is a significant performance penalty. MOB allows store to forward data to a conflicting load only if the following conditions are met:
The store is complete in the MOB.
The addresses referenced by the store and the load have the same alignment, i.e. both the store and load requests begin at the same address.
The data requested by the load is a subset of the data written by the store.
Otherwise, the MOB will block the conflicting load. To prevent this stall, use the same data sizes and address alignments when you read and write data to the same address or an overlapping range. When you must write and then read differently-sized data elements from the same area of memory, reorder the code so that the read is as far as possible after the write (tens of cycles).
Detecting Partial Stalls
The first stage in cleaning the partial stalls in the code is their detection. A partial stall is significant to the performance of the application only if it is executed frequently in the code. The best tool to evaluate the significance of the problem and to detect the partial stalls is VTune(TM) Performance Analyzer. Partial stalls can be detected statically by static code analysis and dynamically using event-based sampling. To sample the event, create a test example. The test example should have the following characteristics:
Represent the workload of your product and execute the important components of the code.
Be repeatable and preferably automated.
Run for 10 seconds or more if your code is executed almost 100% of the time. If not, create a longer test. For example, if your code is utilized only 5% of the time, run the test for 200 seconds in order to spend about 10 seconds in your code.
Sample code: int a;
main()
{
int i;
for (i = 0; i < 100000000; i++)
a = i | 0xff00;
}
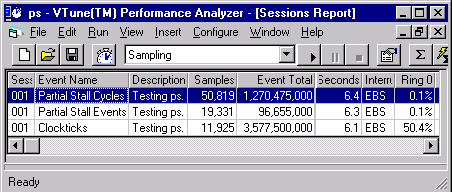
The relevant events are partial stall events and partial stall cycles. Select these events using the menu option Configure | Options | Sampling | Processor Events for EBS. In addition,sample for clock ticks too. Then look at the sampling session's summary view. You can see the partial stall events and cycles using the VTune Performance Analyzer, shown in Figure 1.
|
Figure 1. The VTune Performance Analyzer |
This example had about 88M partial stalls and as a result lost 594M cycles. The machine was a 300Mhz Pentium II processor. One processor was in idle mode and lost about two seconds of the 3.4 seconds it took to run the code.
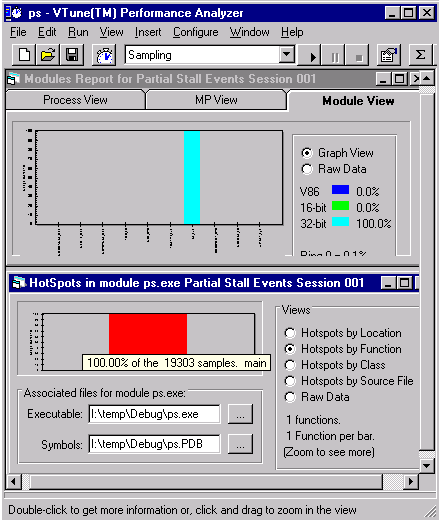
If the total partial stall cycles is very low, saving the lost cycles does not cause a significant speedup. If it is higher you can zoom into hot spots of partial stalls. The hot spot view appears in Figure 2.
|
Figure 2. The hot spot view. |
Only one hot spot has all the partial stall events. Click on the hot spot to display the offending line of code; in this case
a = i | 0xff00;
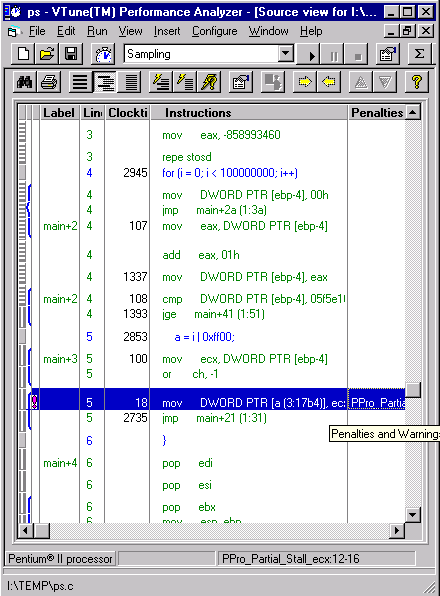
It is not immediately clear why this line causes a partial stall, so examine the mixed assembly/source view, shown in Figure 3.
|
Figure 3. The mixed assembly/source view. |
The compiler elected to "optimize" the logical or (|) operation and use an 8-bit register instead of a 32-bit register. Click on the instruction marked ! to get the full story with context-sensitive help.
In this case the solution is to use the Pentium Pro code generation strategy instead of the default blended strategy in the compiler code generation options. In many other cases changing the compiler flags may not solve the problem. The compiler may generate partial stalls as a result of mixing unsigned chars with integer code amongst other reasons. In most cases, by changing the code you can work around the problem.
Statically Detecting Partial and MOB Stalls
Another simple way to detect partial stalls is to open the static code analysis view, request a detailed view of the functions with code, and click on the warning column to sort the functions by warning. Click on functions with Pentium Pro warnings to jump to the relevant source code. Partial stalls are marked with PPro_Partial_Stall and MOB stalls with PPro_Mem_Stall, so search for the string PPro_ using the Find option. This helps you navigate to all the instructions indicated by the ! mark. For every warning, ensure that the code is active in this area (look for clock tick samples). Optimizing code that is executed infrequently does not help overall performance.
Dynamically Detecting MOB Stalls
Unfortunately there is no event that counts MOB stalls. Several other events can indicate a performance problem possibly due to a MOB stall. The relevant events are:
Micro-Ops Retired - Low Parallelization
Resource Related Stalls
Store Buffer Block
Each one of these events can have a high count as a result of several other performance issues well as a MOB stall. The Resource related stall and the low parallelization events are general events that indicate a problem. We can use the number of those events as an indication of the cost of the problem. Resource Related Stalls event counts the number of clock cycles executed while a resource-related stall occurs. This includes stalls due to register renaming buffer entries, memory buffer entries, branch misprediction recovery, and delay in retiring mispredicted branches. If there are no performance problems, resource stalls should not be a concern. However, if the system is not running at full speed, the event may indicate one of the several possible problems including MOB stalls.
The Store Buffer Block event indicates the number of times that a load is blocked and stopped from executing. As such it can be used to count the number of MOB stalls. The reasons for this event include:
A preceding store whose address is unknown.
A preceding store whose address is known to conflict, but whose data is unknown.
A preceding store that conflicts with the load, but which incompletely overlaps the load.
The last source of this event is the one that will be created by MOB stall. The problem with this event is that the first two reasons are more common, and as a result it may require a lot of work to identify the MOB stall cases.
The following example shows a simple loop with a MOB stall that executes 100M times. T The C function and and assembly code for this loop is:
char a[4];
int b;
main()
{
int i,j;
for (i = 0; i < 100000000; i++)
{
a[0] = 2;
b = ((int *)a)[0];
}
}
LOOP: mov byte ptr _a, 2
mov edx, dword ptr _a
inc eax
mov dword ptr _b, edx
jne loop
A byte value is written to variable a and in the next instruction a 32-bit value is read from the same variable.
After selecting the code area of the loop and using the event ratio icon you can cat the total event table. In this case I got:
Event or Ratio | Value |
Clockticks | 1104000000 |
Resource Related Stalls | 785232000 |
Store Buffer Block | 94374130 |
Micro-Ops Retired - Low parallelization | 398280000 |
In this example according to the Clock Tick event, the MOB stall causes a loss of 8 cycles. The Micro-Ops retired - Low parallelization event indicates an average loss of about four cycles every iteration. The resource-related stall is about 7.8 cycles for iteration. The store buffer block number is about 0.94 times every iteration. These events indicate the presence of a MOB stall or other store buffer-blocking problem.
In this example, no pending cache miss writes were waiting in the store buffer. If there was a MOB stall while waiting to empty the write buffer, the penalty could have been tens of cycles or more.
Conclusion
You can improve the performance of your application by detecting and fixing microarchitectural bottlenecks (also known as "glass jaws") such as partial and MOB stalls. Compiler performance problems or faulty assembly coding can cause partial stalls. When the compiler is at fault, using the Pentium Pro code generation instead of the default blending option may fix the problem. Otherwise, minor code modifications can help, such as using 32-bit values instead of 8-bit for the problematic variable. In assembly code, algorithmic reasons such as packing several colors in one pixel register may cause a partial stall. In those cases, use shifts rather than trying to utilize the 8-bit parts of a register.
For example, examine this code:
RGB MACRO red, green, blue
XOR EAX,EAX
MOV AH,blue
SHL EAX,8
MOV AH,green
MOV AL,red
ENDM
Two partial stalls are created; one during the SHL instruction, and the other when using the EAX register as the result of the macro. Change the code to prevent partial stalls as follows:
RGB MACRO red, green, blue
XOR EAX,EAX
MOV EAX,blue
SHL EAX,8
OR EAX,green
SHL EAX,8
OR EAX,red
ENDM
MOB stalls can result from algorithmic needs, such as packing elements together for SIMD Streaming Extensions or MMX intructions. In these cases, try to pack all the elements of the array before using the results. If the distance between writing the value and reading it again is long, we can assume that the value is already in memory. Another source of MOB stalls can be a compiler performance bug. For example, in most compilers the code to convert an unsigned 32-bit value to floating-point looks like this:
MOV dword ptr [ebp-10h],eax
MOV dword ptr [ebp-0Ch],0
FILD qword ptr [ebp-10h]
If you know that the most significant bit of your value is zero, cast the value to int before the conversion. The compiler will use the dword version of FILD instead of the qword version, thus shortening the code and preventing the partial stall.
This article describes ways to detect and eliminate partial stalls. Applying these techniques is not difficult. In most cases, the gain in speed is not dramatic, but the return on investment is relatively high. Future articles in this column will address similar instances. For more information about specific microarchitectural optimizations, see http://developer.intel.com/vtune/cbts/cbts.htm
Haim Barad has a Ph.D. in Electrical Engineering (1987) from the University of Southern California. His areas of concentration are in 3D graphics, video and image processing. Haim was on the Electrical Engineering faculty at Tulane University before joining Intel in 1995. Haim is a staff engineer and currently leads the Media Team at Intel's Israel Design Center (IDC) in Haifa, Israel.
About the Author(s)
You May Also Like