
Trending
Opinion: How will Project 2025 impact game developers?
The Heritage Foundation's manifesto for the possible next administration could do great harm to many, including large portions of the game development community.
Having trouble figuring out how difficult your game really is? Xibalba Studios lead game designer Rafael Vázquez devises a method for plotting difficulty -- and uses three popular sidescrolling action games to test the theory, in the process explaining how difficulty meshes their overall design.

[Having trouble figuring out how difficult your game really is? Xibalba Studios lead game designer Rafael Vázquez devises a method for plotting difficulty -- and uses three popular sidescrolling action games to test the theory, in the process explaining how difficulty meshes their overall design.]
A few months ago, during the prototype stage for a new project, I noticed a problem starting to brew. We were having lots of trouble identifying the ideal difficulty for our game, as different members of the team had very different ideas on what is the perfect challenge.
I know this is a common issue for small, diverse teams, as what one member might think is a walk in the park another will find more akin to torture. The problem was that everyone had different skill levels, and because of this we weren't going to reach an agreement anytime soon.
After thinking about this issue for some time, it came to me that difficulty in a game should not be related to player skill, but to the game itself. Instead of looking at the game's difficulty as a static, all-encompassing threshold, we would do better to discuss how it changes throughout the game.
With this in mind, I tried to develop a method to measure and compare how challenge rises and falls across a game, independent of the player's skill. This article tries to explain this method. It might still be a little rough around the edges, but I believe it's a good start, and I hope it encourages discussion in the community so the method can be perfected.
Getting difficulty right is tough. It might seem redundant, but that doesn't make it any less true. Make the game too difficult, and people will get frustrated; make it too easy, and they get bored. This is common knowledge, and so designers typically strive for the middle ground. Most of the time, we do this by gut feeling, which is fine.
As it is, the game's difficulty really depends on the type of game and the type of response we want to get out of the player. A calming social game and an adrenaline-pumping FPS are worlds apart in challenge. The problem comes when you try to talk about this challenge to your fellow team. Long hours pass, and no one seems to agree if that game section is just the right amount of tough.
This is because difficulty is subjective; it depends a great deal on an individual's skill. To make things worse, the right difficulty also depends on what each person finds fun; some people like masocore games like Super Meat Boy. So when you're trying to create a game, it's a real problem to find common ground from where to start discussing.
There is a solution, however -- a method to find a common base which we can all agree on: difficulty graphs. Before we dive in though, a quick disclaimer. This method is not for creating difficulty (that's still up to the designer's gut, I'm afraid), but for difficulty analysis, and as a means to start meaningful conversation with the rest of your team about it. These graphs don't show you how a difficult a game should be -- only how difficult it is.
They are graphical representations of how difficulty changes throughout the game. This is to say that they plot how challenge changes over time. There are two main types, time-based and distance-based. The first places the spikes in challenge according to the time spent played (taking away paused time and death); while the second places them depending on where the challenges appear (assuming a direct route from start to goal).
 Both have their advantages, and some work best depending on which type of game you're testing. For arcade games like Asteroids or Geometry Wars, time-based is really the only way to go, as there is no real displacement towards a goal.
On the other hand, most FPS use location-based triggers for their enemies, so distance-based graphs work very well. Personally, I like time-based graphs better, and we'll get to why in a moment.
Nitpickers might have already noticed that both of these still depend on the player. How fast the player goes through a level and how much time it takes him to get from one challenge to the other depends on how good he is at the game, and also at his play style (if he likes exploring, you can kiss time-based graphs goodbye).
The truth is that our medium is experienced differently by each and every one of us, and this is something we have to live with. The best we can do is get data from multiple playthroughs from different people and average them out. As a matter of fact, difficulty curves can only be applied after playtesting the game several times. After enough testers have tried the game, you'll get a pretty good idea of what the average player experience is.
As you might recall, difficulty is subjective, and asking all the testers if they felt the game too difficult might give you wildly different answers (you should still do it, though). How then can we measure a game's difficulty if it depends on the eye of the beholder? The trick is we compare it onto itself.
Say we have a basic enemy that deals x amount of damage. Let's say he has a threat level of 1; this will be our base enemy. The threat level is basically how difficult an enemy is compared to the player. If, on the other hand, we have another enemy with twice the amount of firepower but the same in all other aspects, we can go ahead and say that it is twice as dangerous and give him a threat level of 2.
I know this might seem to oversimplify things, and that other factors like location, position, and the presence of other enemies matter... We'll get there. The point is that, by taking the easiest challenge present as a standard (your base enemy), and comparing it with other challenges in the game we can quantify how tough each one is independent of skill. No matter how good you are, an enemy that is three times faster is tougher than the standard.
However, the enemy's stats are not the only things that affect difficulty. If the enemy spawns behind the player or on top of him, it changes how tough they appear to be. Even puny low-level enemies can be quite a challenge if they appear out of nowhere.
That's not all. A flying enemy is tougher than a land-based foe, as is one that is hiding behind cover. On the other hand, a distracted enemy, or one that is looking for you somewhere else, is a piece of cake. The situation affects dramatically the difficulty of a given challenge. To account for this, we use a situation multiplier.
A situation multiplier is a number that tells us how much more difficult an obstacle is due to its spatial relation to the player. The exact nature of each multiplier depends largely on the design of the game.
Flying enemies are not as much of a problem in a twin stick shooter as they are in a D-pad based shooter, simply due to the precision of aiming. Hence how much each multiplier weighs is up to the designer, who has to check them depending on the game's mechanics.
A good way to get an idea of how easy it is to overcome an enemy is basing it on how many actions the player has to do to get them. The more straightforward the killing, the easier it is.
Having this, we can multiply them by the enemy's difficulty value. Suppose, for example, spawning behind the player is a 1.2 multiplier and that we have an enemy of threat level 3; if that enemy spawns behind the player his new threat value would be 3.6.
We also have to take into account that most of the times enemies don't come alone; they bring along buddies. In that case we simply add the difficulty of all enemies that appear at the same time (or at the same place). This would give us the difficulty value for the wave of enemies. This is why I like using time-based graphs, as an enemy encounter (borrowing Mike Birkhead's definition) can have several waves in the same spot, most of the time triggered by defeating the previous wave. A distance-based curve might mark them up as being all at once, which is not entirely true.
So the base formula to find a wave's difficulty would be:
Ʃn=0 = (ETn)(ESn)
Where: n is a specific enemy in a wave.
ET is the enemy threat level.
ES is the situation multiplier.
After finding the total difficulty value for the wave, you just have to plot when or where the player finds it. Do this for all waves in a level and... ta-da! You get a difficulty graph!
There's one more aspect that I haven't touched yet: power-ups. It's a really big field, and it probably deserves its own piece, but we can't just ignore how it affects difficulty. You see, when comparing an enemy's or wave's difficulty we do it under standard conditions.
Among other things, this means that we assume the player character will be at the same level of power and have the same set of skills during the progress of the level. Frequently this is not the case, and the player will gain or lose abilities throughout the game. This presents a problem, as enemy A will not have the same threat level before and after you give the player a nuclear bomb. Power-ups can occur at any point of the game, even inside an encounter -- and so they have to be taken into account.
We can roughly divide power-ups into two main types: permanent and temporary. Permanent power-ups are those that once obtained are never lost during gameplay. This includes new abilities ("You can now double jump!") and new weapons with easily acquired ammunition (for example, by enemy drops). On the other hand, temporary power-ups are those which can be lost during gameplay, for example by dying, or that have limited ammunition (only six bullets in the whole level). Once lost, they are gone for good.
When faced with the first kind, you can safely assume that the standard conditions have changed (sticking to your pea shooter throughout a game is not normal player behavior.) This means that you can recalculate the enemies' threat level to this new standard. An enemy which needed 10 shots to kill now only needs two, if everything else stays the same, he would be five times less dangerous.
Temporary power-ups are trickier. The problem with these is that you can't really know if the player has them at any given moment. Balancing difficulty with the idea that they have the power-up can lead to severe player frustration as they face enormous difficulty spikes. There is no easy way around this, but what we can do is to create a graph under the previous standard condition (as if the player never acquired the power-up) and then mark their position on the graph with a vertical line. This way, although we plot for the worst case scenario, we can clearly see where power-ups could help the player.
So, let's recap the steps:
First, you have to determine what the game's standard conditions are. This is the minimum power level the player has during a determined segment of the game (be it a stage, a level or the whole game). This can vary often due to permanent power-ups.
Find the base enemy (generally the weakest or most generic enemy) and set its threat level to 1, and adjust the threat level of all other enemies in accordance to its stats.
Playtest. A lot. Have different players with different play styles move through the level so that you can get the average time (if doing time-based difficulty charts) or average distance (if the chart is distance-based) of each enemy encounter.
Check which situations you find the enemies in, and assign values to those situations depending on how the mechanics and enemy behaviors allow you to fight them.
Determine how the encounters work. Figure out how many waves there are in each encounter and what enemies they are composed of.
Ʃn=0 = (Etn)(ESn) Multiply each enemy's threat level by the situation multiplier and add them all up for each wave.
Plot them in a graph according to the time when they appeared or the distance from the starting point where you meet them.
Just to show an example of how they look, I followed this method to plot three different 2D sidescrolling shooters using time-based difficulty graphs. The games chosen come from different consoles and different eras just to show that this method is universal (and because they're the ones I had easy access to).
The example games are Metal Slug (published by SNK in 1996 for arcades), Shank (developed in 2010 by Klei Entertainment; this test is based on the PC version) and Hard Corps: Uprising (created by Arc System Works in 2011 for Xbox Live Arcade and PSN).
Now, they might seem quite similar on the surface, but they have several nuances that make them different. This is important to mention, because the difficulty graphs do not actually show which game is harder. Remember that the difficulty is measured based on the game itself; a 1 in Shank is not the same as a 1 in Metal Slug.
What the graphs do show us is how the difficulty changes throughout the game, and this in turn gives us clues on the pacing and tension building of the game. Lots of spikes and you can bet it's a fast-paced, tense game; lots of plateaus and it's likely it is calmer.
Note: A great method for directly measuring pacing is Ben Cousins' method of counting player actions. He describes it in his article Elementary Game Design, which you can find at his personal website, http://www.bencousins.com.
These graphs show the first level of each game from start to right before the boss. I'm leaving out boss encounters because they generally change the rules, requiring specific mechanics for victory. Comparing them directly with the rest of the level can cause gargantuan spikes in the chart that are not really representative of how hard the game is overall.
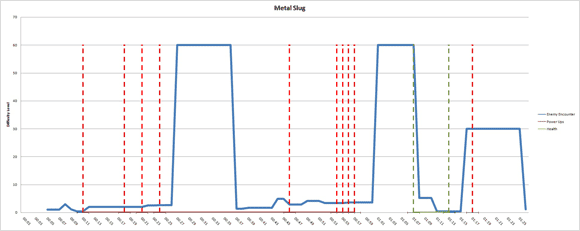
First up, Metal Slug, the shortest of the bunch (clocking at around 1:20). We can see that it presents enemy encounters every two to three seconds. Besides your standard pistol, the game starts you with some grenades, which are a hard-hitting, though limited, weapon. Unlike the other two, it features one-hit-kills (another way to say all enemies do the same amount of damage) and hefty temporary power-ups, including the titular Metal Slug (a tank, basically). As an arcade game, death isn't a big deal, as each continue will respawn you at the point of death. This is, of course, until you run out of quarters.
(click for full size)
We can see that the basic trend is quite close to the horizontal axis, with a smooth rise throughout the level. There are two large spikes which represent helicopters. Under standard conditions they are quite tough (taking around 40 shots from your basic pistol to take down). The camera freezes and stops your movement until you kill them, making sure you can't just skip ahead, explaining the plateaus.
To help you out, the game provides you with power-ups (red vertical lines) right before facing them. As all power-ups in Metal Slug are temporary, the game makes sure you have at least one by dropping a bunch of them really close to one another.
There is another rather large spike near the end, once you start facing other tanks. Provided that you still have your Slug, they should be no problem; however, if you lost it to the helicopter, you could be in a tough spot. The game balances this by giving you health for your tank (the green vertical lines) right after the second chopper and just before the tank section, again trying to make sure you don't miss out.
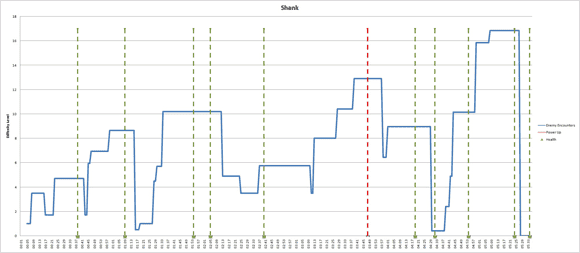
Next we have Shank, whose first level is around five and a half minutes long. Contrary to Metal Slug, you have a health bar in the game, so enemy attacks aren't so devastating. Also the game starts you out with four weapons (pistols, knives, a chainsaw, and limited grenades) allowing you to take on several enemies at once. On the flipside, there are no power-ups except health and more grenades, so what you start with is what you get.
(click for full size)
At first glance, we can see that the game is a slower-paced than Metal Slug, due in large part to having clearly-defined encounters in which the player can't move ahead. We can also see that in most encounters, enemies appear drip by drip, leading to the stair-like form of the curve. The obvious point of this is easing the player into combat, instead of presenting the challenge all at once.
Between large encounters (which can be distinguished by the high plateaus), we find that the game always presents a couple of enemies, so that the challenge never gets too low.
Just like in the previous example we have a spike near the end -- however, this is an absolute spike, presenting the hardest part of the level. After this we see a steep decline until we get to zero, the complete absence of enemies and obstacles, in preparation for the boss battle.
Interestingly, we see that health packs are commonly found in the middle of the encounter (usually because they are enemy drops) and tend to be found more frequently at the later stages of the level. On the other hand, only once can we restock grenades; this is most likely due to the game trying to get the player to learn to use his three main weapons.
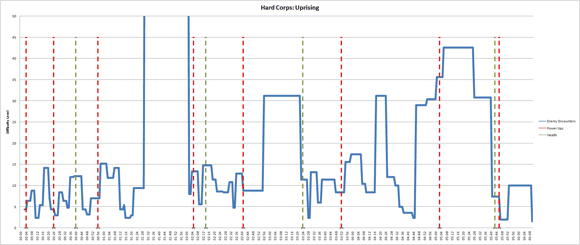
Lastly we have Hard Corps: Uprising. In this game, the player has a segmented health bar, with the base enemies taking a full segment with each hit. Though the player only starts with a weak machine gun, she is able to pick up several power-ups which are lost when hit. The first level (minus the boss) clocks in at around 6:20 and is easily the longest of the bunch.
Despite having an Arcade Mode (no character building), the game's star attraction is the Rising Mode, which allows the player to gain experience and permanently upgrade her character even if she dies. In other words, it allows for grind.
(click for full size)
First off, you'll notice the off-the-chart spike; I intentionally left it there. This is the miniboss (the typical Contra wall). Clearly its power is off the roof -- it takes many hits to bring down and has powerful attacks. However, once you battle it, you'll notice the terrain gives you a great advantage against it, so in the end it's not really that tough. This is why it's recommended to treat your boss fights as special cases. They work differently, often with different rules and game mechanics -- hence, they don't really relate with the whole level.
Putting the miniboss aside, we can see that the game has a very spiky difficulty curve, with short plateaus and lots of ups and downs. This is decidedly a fast-paced game. Despite its ups and downs, the mean does tend to go up throughout the level, with longer confrontations and more enemies being faced at a time.
While encounters near the beginning of the level are at around seven, near the end they reach 30. This is a massive slope in difficulty, perfect for a grind-friendly game. Near the end we once again find a major confrontation followed by a brief respite before fighting the boss. Notice that power-ups are evenly distributed throughout the level, as they form an integral part of the game mechanics. On the other hand, health is much rarer, though it is also found at equal intervals.
We can compare all games' graphs by simply normalizing the time (dividing it by their total length) and plotting them together. Once more, this is not a measure of how difficult a game is, but how that difficulty changes. Here we can see that in all three games, the difficulty curve's mean is below 10, which is quite usual for first levels. Hard Corps is the one with the highest change in difficulty, while Shank is a lot more constant. Metal Slug is also quite constant with few (though large) spikes.
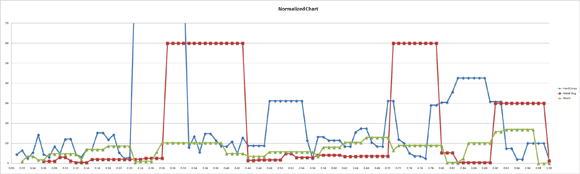
(click for full size)
If we start thinking about the overall design of each game, we see that these differences make a lot of sense. The grind and permanent power-ups of Hard Corps allow it to have a steep difficulty curve throughout the level, and actually encourages the player to start over several times to pass it. Meanwhile, arcade Metal Slug, which is trying to suck you out of quarters, depends on minibosses to provide challenge, allowing you to beat them in multiple tries (as long as you pay). Shank, on the other hand, seeks accessibility, having a smooth curve, which allows new players to ease into the game.
Analysis by difficulty graphs tells us a lot about a game -- not only about the way it's structured, and the way it looks for engagement, but also about the design philosophy behind each game. It's also useful while designing your own games as an analytical way to find spikes and valleys that shouldn't be there.
Of course, this is not the only method of measuring difficulty; however, this has been very useful as it is independent of individual player skill. Once the results are in, everyone in a team can easily see where the trouble spots are, and it makes tackling them together a lot easier. I really recommend you give it a go. You'll be surprised how much this makes difficulty easier.
Read more about:
FeaturesYou May Also Like