Featured Blog | This community-written post highlights the best of what the game industry has to offer. Read more like it on the Game Developer Blogs.
Back to basics: Intensity/Time graphs and balancing
The intensity over time graph is a foundational game design concept. Just a quick look at ways to implement this and how to identify balancing-related issues.

One of the oldest and most endearing bits of quantitative game design is the intensity/time graph. That is, the longer you play the game the more intense it gets. Simple, right? We all know that level 2 should be harder than level 1 and the boss battle at the end of the level should be more intense than the start of the level. It is one of the things that makes a game engaging.

Graphing Intensity over Time
There are more than a couple ways to manipulate these curves, of course. On the programming/scripting side we can decrease the spawn time between enemies or decrease the chances that random pickups will deliver a high-valued items or increase the alertness of AI enemies. On the design side of the proverbial coin we can make pickups or hiding places more scarce or add more hazards or, in a more direct sense, add a timer till a bomb blows up or until you run out of oxygen if underwater or in a poison cloud.
However, looking at this issue as a single curve can have big implications in the testing/balancing stage.
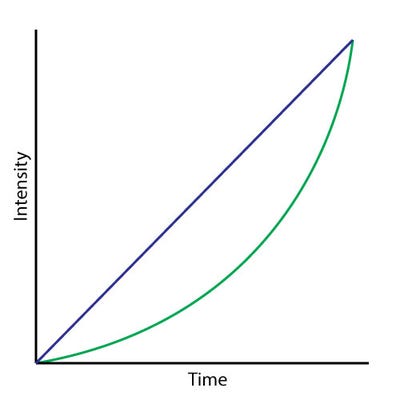
A quick look at the graph here shows a linear increase of intensity over time (blue) and a parabolic one (green). There are arguments for using both and, indeed, linear is more easily implemented - the timer idea which we'll examine in a minute. However, the parabolic approach allows players to learn game mechanics easier in the early stages and then demonstrate their mastery of these mechanics sooner.
These graphs are, of course, not necessarily mutually exclusive. Consider a platformer where your character is carrying a bomb ticking and has to deliver it to the end of the level before detonation. A timer shows when the bomb will go kablam. As the bomb gets closer to detonation it gets hotter. The hotter the bomb gets the shorter you can hold it. So you must periodically put it down or use a cooling spell or gadget or something else that has a charge up time. This is clearly linear intensity implemented procedurally. Multiple linear intensities - time bomb ticking, cooling rate of dropped bomb, and recharge rate of cooling spell/gadget/something else.
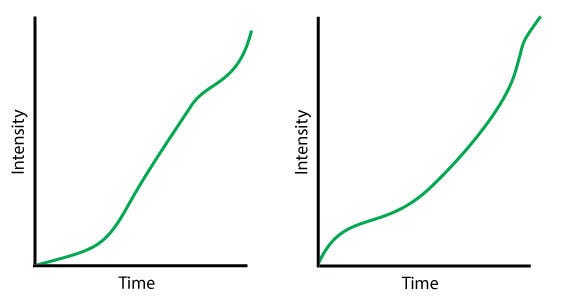
These can be compounded by design implementation of platforms and enemies by controlling the placement and spawning of platforms/hazards and enemy/pickup types respectively. By manipulating these you can create a more interesting intensity/time graph to better suit your game/level:
Possible Intensity/Time graphs
Level 1 - let them learn controls and practice before a more challenging end. Level 2 - reinforce mechanics learned from level 1 and increase parabolically to the end of the level. Maybe after the initial spike introduce a new mechanic during the lull.
You've now got multiple intensity curves to merge and balance that are independent and intermingled. What's more, some are balanced by the level designer and others in code/script. If you are on a small team with a short communication loop this will be easier to handle - heck the designer/coder may be the same person. But if they aren't, balancing this can become a logistical issue.
Perhaps it is best to determine early on what factors contribute to the intensity/time graph in an effort to streamline testing/balancing. This will be different for each scenario, but that's kinda the whole point, right?
You can follow me on twitter (@devjana) if so inclined.
Read more about:
Featured BlogsAbout the Author(s)
You May Also Like


