


Trending
Opinion: How will Project 2025 impact game developers?
The Heritage Foundation's manifesto for the possible next administration could do great harm to many, including large portions of the game development community.
In the follow-up to his original article, Dmitry Nozhnin, head of analytics and monetization at Russian MMO publisher Innova, shares his methodology for predicting when veteran players will quit the game -- identifying when players will drop two to three weeks before they do.
August 30, 2012

Author: by Dmitry Nozhnin
In the follow-up to his original article on predicting player churn, Dmitry Nozhnin, head of analytics and monetization at Russian MMO publisher Innova, shares his methodology for predicting when veteran players will quit the game -- identifying when players will drop two to three weeks before they do with 95 accuracy, all carried out in the live environment of the Russian version of NCSoft's Aion.
In my previous article, I showed the process we developed for predicting churn of our freshest users, who just registered for the game, based on data collected during the first couple of days of their adventures. However, on the other end of spectrum are seasoned gamers who have spent months and months in the game, but for various reasons decided to abandon it. Predicting their desire to leave the game is possible, and in this article, we're sharing our data mining methodology.
Nothing changed from the first data-mining project; we were still on two Dual Xeon E5630 blades with 32GB RAM, 10TB cold and 3TB hot storage RAID10 SAS units. Both blades were running MS SQL 2008R2 -- one as a data warehouse, and the other for MS Analysis Services. Only the standard Microsoft BI software stack was used.
Our dataset had up to six months of recorded gameplay for about 38,000 veteran players.
For new players, defining churn was dead simple -- they just leave the game after a couple of minutes or hours. That's it. The last day of play was clearly defined, and data mining models on such churn factors were already well established. However, for veterans, it took us several iterations to define churn correctly. Our first assumption was this: the player is enjoying the game for some time, but then he decides to quit and leaves. Marking his play days with green, we expected something like this:
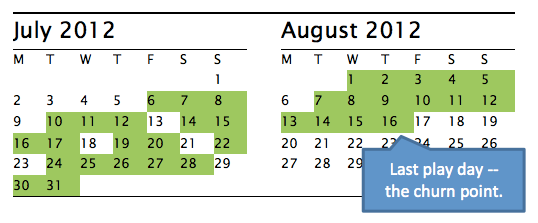
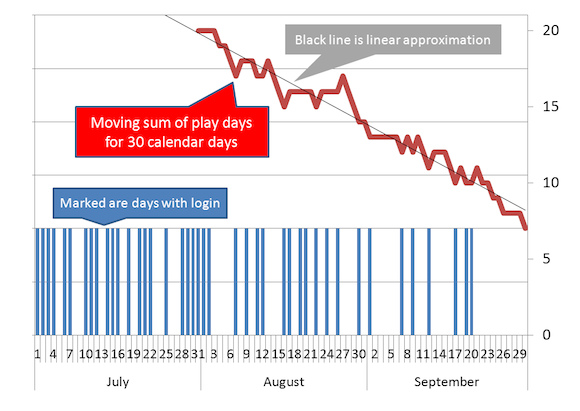
Our guess was that defining the churn point would be straightforward -- the last game day. The reality, however, was more complex; the majority of players behave like this:
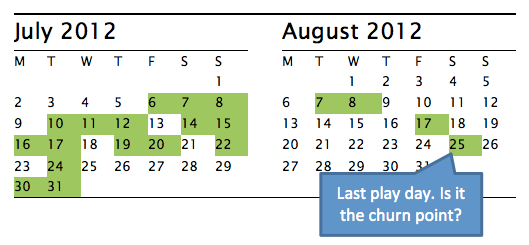
Is August 25th, when we've seen the player for the last time, the churn point? Or in fact August 16th, the day we hadn't seen the player for seven consecutive days? Or July 31st, the first time she hadn't launched the game for more than seven days? We tried several hypotheses, and the simple ones didn't work out. Defining the churn in a simple way -- predicting that a particular play day will be the last one -- resulted in unimpressive 65 percent precision.
Manual data investigation revealed that majority of churners have a "long tail" of play days -- those occasional activity days during several weeks, or even months, as shown on the second calendar example. They effectively stopped actively playing the game, but still log in from time to time. In fact, they had already quit; occasional logins are for auction sales, random chats, or probably indicate that the account has been passed on to guildmates.
The next step was to cut off this tail using some empirical thresholds in order to trace back to the day when the player's activity decline started. The most effective query was something like "the last day of play when total game days for the previous 30 calendar days were fewer than 9". Still, the precision was under 80 percent, and empirical rules didn't work for loyal but very casual players.
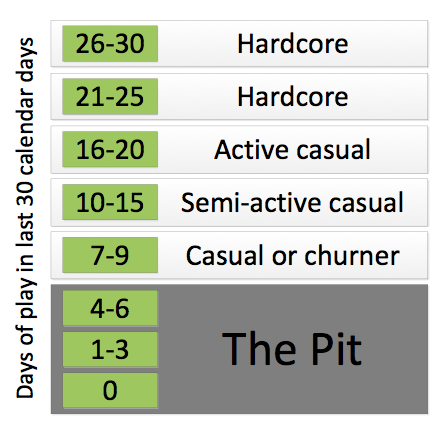
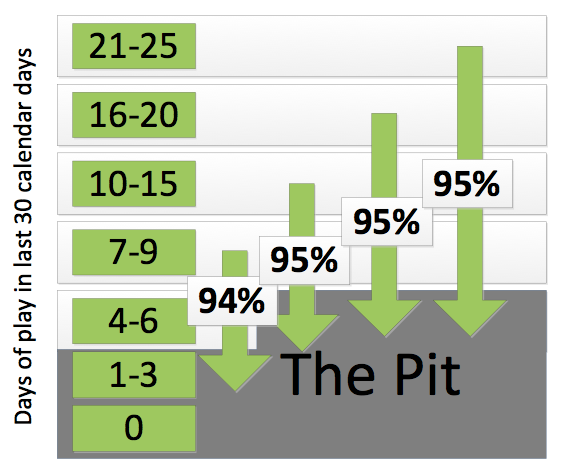
Key success factor of this project was reframing the moment of churn from "the player has left the game" to "the player's activity has dropped below the churn threshold". We already store and widely use the Frequency metric, defined as "days with game logins in last 30 calendar days". In short, it means how often player has been playing -- every day, every other day, on weekends, or just a few days a month. We segment players according to their play frequency:
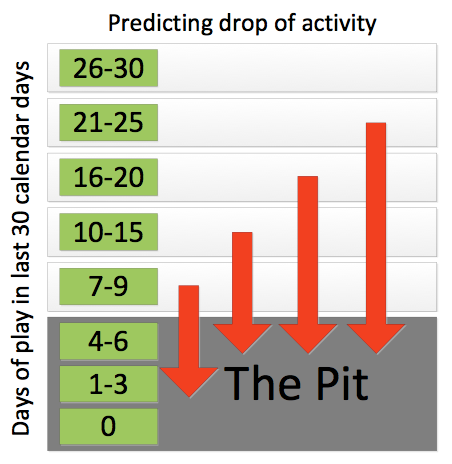
The next step is redefining churn as they fall into The Pit, an area of extreme inactivity with very high probability to churn. This idea really makes sense from business point of view -- instead of detecting churners the day the leave the game forever, we're now focusing on early detection and prediction of disinterested players, and have several weeks to incentivize them to keep playing.
The new approach was to predict players who will fall down into The Pit in two weeks for 7-9, 10-15, and 16-20 cohorts, and in three weeks for the 21-25 cohort. So we're looking for players who are losing momentum, and whose activity will drop significantly over the next several weeks:
One of the key insights from the first project was how important general activity metrics are for predicting churn.
We expected them to also be important for analyzing veteran players, but nonetheless decided to try some game-specific and social metrics as well:
Chat activity -- whispers, guild chat, and common chat messages
Crafting and resource harvesting
PvP and PvE instances visited
Max character level on account
Remaining paid subscription days
Daily activity and playtime were expected to be key predicting factors, and so they are.
When we analyzed new players, we had only a couple of days of data, thus using simple instant values. However for veterans we think in terms of weeks and months, so different approach is required for data aggregation over time. Moving totals and moving averages, derivatives and intercepts are useful in this case.
We used a moving 30-days sum for analyzing long-term daily activity, approximated by a linear equation. The actual metrics that went into data-mining model were slope and intercept of the approximation line. Their calculation with ordinary least squares method is fairly easy with T-SQL during the data preparation process.
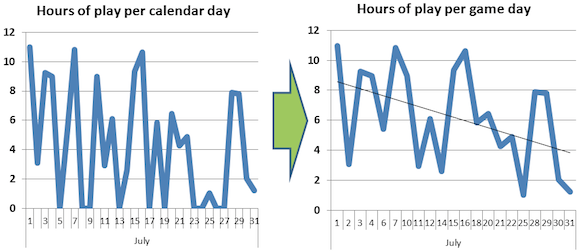
For daily playtimes' analysis, days of inactivity with zero playtimes were stripped before applying approximation:
ETL procedures had to be rewritten from scratch and all data reloaded, but idea was well worth it: even first results on raw, untuned data mining models for the 16-20 cohort were around 80 percent precision.
In the end, with about 30 metrics with different aggregation periods and methods, we achieved 80 to 90 percent precision in predicting players who are about to fall into The Pit in two to three weeks. This is quite an impressive result, but for a couple of months we were stuck with it, no matter what new metrics and methods we tried. Finally, a breakthrough happened with the introduction of detailed past metrics.
The timeline of our model, by that time, was like this:
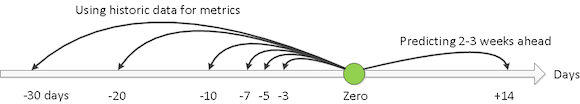
The zero point is the day for which we're predicting the future. The forecast is being made for two to three weeks ahead, depending on cohort, as described earlier. Data-mining models are fed with various metrics for past periods, like first derivative of moving average of daily playtime per game day, calculated for past X days. All metrics were calculated based on last X days from point zero -- last three days, five, a week ago, and so on.
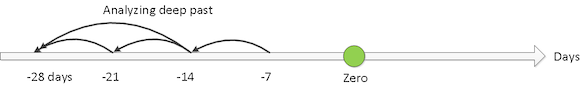
A fresh idea was to calculate some metrics relative to points in the past. For example, we could calculate first derivative of moving average of daily playtime per game day for 7 days, but looking back 14 days before point zero. Remember what I said about long tail effect of players' activity? Essentially the idea is to dissect the tail into separate parts and analyze them as independent metrics. We have tried some combinations of such detailed past queries, like (7,-21) - 7 days period 21 days into the past, (7,-14), (7,-7) and (14,-14).
This idea was our epic win, boosting precision and recall after some manual tuning to 95 percent for almost all cohorts:
Most fascinating is the fact that final data mining models with best precision were entirely based on derivatives and calculations of only two metrics -- days of activity and daily playtime! For different segments, different derivatives were important. In case of models for 21-25, all our detailed past calculations were important. But for the 7-9 cohort, models were based on 30-day averages as well as near-past metrics for 3 and 5 days before point zero. At any rate, the math is much more complex than it was for new players' churn predictions. The following is the example of final data mining models (click to see full picture):
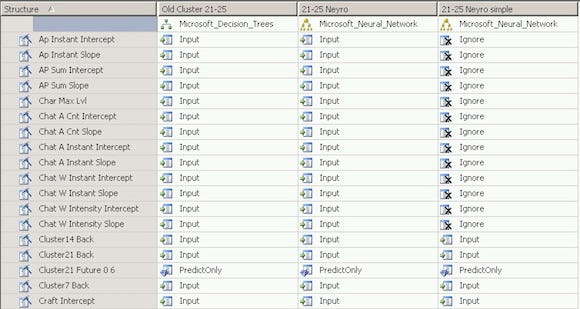
And if it looks like a black box with some mystical math inside -- well, you're right. Back when we learned how to predict new players' churn, an alarming fact was that despite the great precision of the model we arrived at, we knew little about the actual reasons for churn. It's the same for veterans -- we have no human-comprehensible results about the nature of churn. Just an awesome, 95 percent accurate black box.
We're now able to predict dramatic drops of veteran players' activity two to three weeks ahead of their exit from the game, allowing our community managers to take care of those players, resolve their issues, or offer some incentives to boost their loyalty.
This data-mining project was heavier on math and the black box approach than the one for newbie churn prediction, requiring more time for fine-tuning and verifying the results, but leading to 95 percent precision and recall rates. Fascinating is the fact that no gameplay metrics made their way into the final data mining models. Prediction was purely based on metrics derived from days of activity and daily playtimes, which are generic for all games, and probably even for web services.
Read more about:
FeaturesYou May Also Like