

Daily news, dev blogs, and stories from Game Developer straight to your inbox
Sponsored By
NPD: Behind the Numbers, May 2010
In his latest in-depth analysis of the NPD U.S. video game console retail charts for May 2010, Matt Matthews examines "the idea that the retail-focused game industry is not simply in a lull but truly contracting", using exclusive data to probe the state of the market.
20 Min Read

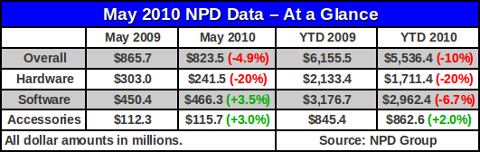
May was supposed to be the bright spot in the first half of 2010 for the U.S. retail console game industry. While software sales were indeed up 3.5% from May 2009, a dramatic 20% drop in hardware dollars dragged the overall industry to a 5% decline -- with $823.5 million in revenue for the month.
That figure – the 5% fall – has dominated the headlines since the market-tracking NPD Group released its estimates for May retail video game sales, lending further weight to the idea that the retail-focused game industry is not simply in a lull but truly contracting, in a “state of persistent secular decline” as analyst Michael Pachter of Wedbush Securities has described it.
We'll examine this perception further, weighing the arguments both for and against. Along the way we'll examine the fortunes of the current hardware platforms, examine software sales in more detail, and take a closer look at titles in the top 20 chart.
Industry At a Glance
The delayed report revealed that overall video game industry retail revenue in May 2010 fell to $823.5 million, down 4.9% from $865.7 million the prior year.
All of this decline came from the hardware segment where overall unit sales dropped from 1.45 million to 1.2 million and dollar sales from $303.0 million to $241.5 million.
By contrast the software segment posted revenues of $466.3 million, a modest 3.5% increase over last May's $450.4 million. All of this growth was driven by console software, with handheld software dollar sales contracting by nearly 20% year-over-year.
As usual, the accessories segment is the only segment that has demonstrated growth both in the year-over-year monthly and year-to-date figures. For the month of May accessory dollar sales were up 3%, with the Xbox Live 1600 Point Card the top-selling item (as it was in March and April), according to NPD analyst Anita Frazier. So far this year, the accessory segment is up 2% over the same time in 2009.
These figures are strictly retail sales estimates and do not include other revenue from subscriptions, downloadable console games (e.g. from Xbox Live Marketplace), subscription-based MMOs (such as World Of Warcraft, which likely has tens of millions of dollars of revenue monthly in the U.S.), or social networking games.
The non-retail revenues may be collected directly by individual private companies with credit or debit cards or via services like PayPal, and are therefore much more difficult to measure. As a result, we no longer have an extremely comprehensive picture of overall industry revenues.
Hardware Declines Examined
When the NPD Group released its May 2010 estimates, the headlines sounded grim. Not only were industry revenues down overall, but software sales had missed analyst estimates – estimates that had in some cases already been revised down based on publisher statements.
We want to step back and ask some very specific questions: In which segments are these declines? How are the individual platforms contributing to the decline, both in terms of hardware and software? Finally, what are the explanations being put forward and how do they jibe with the measurements we've made?
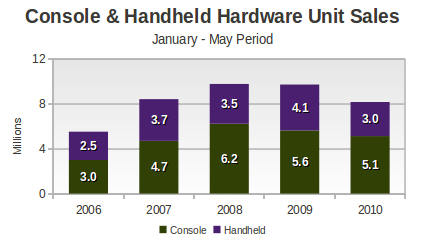
The first question, about broad segments, is fairly straightforward. For example, let us examine the hardware segment, looking at consoles and handhelds as subsegments.
The graph below, and several of the following graphs, provide a comparison of the first five months of each of the years from 2006 to 2010. The introduction of the Nintendo DS Lite took place just after this window in 2006, and by January 2007 the Wii sales boom was well under way; this explains most of the huge jump in both handheld and console hardware sales figures from 2006 to 2007. That marks the beginning of the industry's last boom.
From there, console hardware sales for the first five months of the year peaked in 2008, driven mostly by strong sales of the Wii and, to a lesser extent, the PlayStation 3. Handheld sales for these five-month windows were boosted in 2007 and again in 2009 from sales of the Nintendo DS Lite and Nintendo DSi, respectively.
The fall in 2010, then, is primarily a matter of cooling Nintendo Wii sales (in the console segment) and DS sales (in the handheld segment), with smaller effects from the prolonged decay of both the PlayStation 2 and PlayStation Portable (PSP) systems.
The next figure, which represents the same data but split by manufacturer, makes it clear that Microsoft's hardware sales (in January through May) have remained solid throughout the past five years. As sales of the original Xbox ended, the Xbox 360 smoothly picked up and has managed modest increases for the past three years.
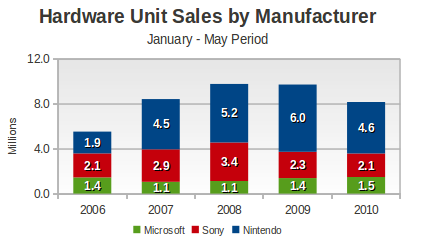
Sony's situation is a bit more complex. The transition from the PlayStation 2 to the PlayStation 3 has been a struggle, and only from January – May 2009 to January – May 2010 can we say that PS3 sales made up for the aging PS2. Throughout all of this PSP rose and then fell, and the PS3 became Sony's dominant platform for the first time in September 2009, nearly three full years after it launched.
Of course, unit sales are only one view of the hardware market. As system prices have fallen – or in the case of the Nintendo DS, risen – the amount of revenue generated by the hardware segment has varied. The figure below demonstrates that, even as hardware sales held steady in the first five months of 2009 (as compared to 2008), the money generated by those sales actually decreased.
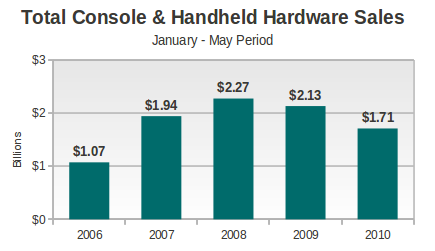
Much of that 6% drop from 2008 to 2009 comes from a rather surprising source: the Nintendo DSi launch. As its unit sales helped keep the industry hardware total stable across those two years, its $170 price is lower than the average hardware price for the entire industry, thus pulling total revenue down despite its robust sales.
By the beginning of 2010, both the Nintendo Wii and the Sony PS3 had gotten price drops of about 20% and 25%, respectively. This jibes well with the 20% decline in total hardware revenue for the first five months of the year, but the underlying dynamics of the revenue picture are more complicated. It would appear that PS3 sales have increased so much in the first five months of 2010 that the system has generated roughly the same amount of revenue, despite the price cut.
The Wii on the other hand has a lower price and sales, which means it contributed to most of the decline in hardware revenue this year, in the neighborhood of $400 million.
The bottom line on 2010 hardware: The Wii price cut and subsequent lower sales during the January to May period has cut revenue significantly while the PS3 has not made up for the long term erosion of PS2 and PSP unit sales and revenue. Microsoft has maintained modest growth in unit sales, and is least to blame for falling hardware revenue.
The Software Decline: Shifting Fortunes
Were it not for the decline in hardware revenues, the perception that the industry is struggling might not be so intense. After all, software revenue grew year-over-year in May 2010 and is down year-to-date by only 6.7%.
However, there is still a lot of movement under the surface, and it is worth breaking the figures out in a bit more detail.
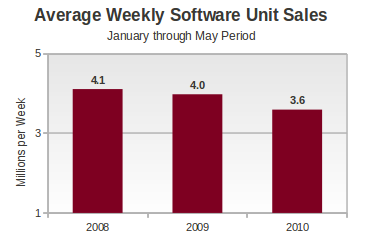
First, it does appear that software unit sales have eroded further in the first five months of 2010 than they did in the first five months of 2009, according to comments made by Wedbush's Pachter.
As the figure below shows, while average weekly software unit sales declined by only 3.2% in the January – May period of 2009 (compared to the previous year), average weekly software unit sales declined a further 9.5% for that period of 2010. (Caveat: The figure below has a vertical axis range of 1.0 to 5.0, to highlight the difference in the rates.)
How big is that differential in absolute terms? Here's one way to view it: if each game in the top 10 during May 2010 had sold three times as well, the industry in 2010 would still not have caught up to level of software unit sales it had achieved year-to-date in May 2009.
Total software revenue has declined only 6.7% this year, noticeably better than the nearly 10% fall in unit sales. The difference, of course, is that consumers are buying slightly more expensive games, leading to an increase in the average selling price (ASP) and lessening the blow that dropping unit sales has had on total revenue.
According to comments made by Wedbush's Pachter, the current situation appears to be a rather interesting reversal of fortunes for Nintendo's Wii and PlayStation 3. In all but two of the last nine months, Wii software revenue has dropped year-over-year by double-digit rates; in the other two months the Wii saw a 10% increase (December 2009) and a more modest 7% decrease (March 2010).
Meanwhile the PlayStation 3 has demonstrated double-digit software revenue increases in all but one of the last nine months; in that other month (December 2009) its year-over-year increase was only 8%.
During that same period the Xbox 360 has seen some amazing months (like November 2009, with the launch of Call of Duty: Modern Warfare 2) and some dismal ones (like January 2010, when its year-over-year software revenue was down by over 60%).
A picture tells the story far more eloquently. Here is our estimated current-generation console software revenue for the first five months of 2009.
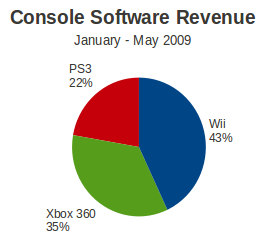
Now compare this to the same measure, but for 2010.
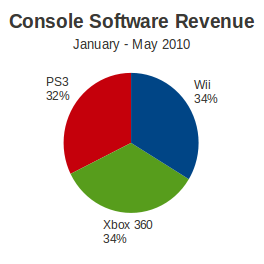
The change is striking: Sony's PlayStation 3 has taken up every bit of marketshare ceded by Nintendo's Wii. Perhaps as important is this fact: the PS3 generated as much software revenue as the Wii in the first five months of 2010, but did so with only 40% of the installed hardware base of Nintendo's console.
If Wii sales have fallen, and handheld software sales have contracted, this does much to explain the increase in the rising prices of software sold at retail. Outside of handheld software, which has been traditionally priced lower than console software, the PlayStation 2 and Wii are the two consoles with the lowest software ASPs.
With the PS2 now accounting for less than 5% of the software market (by revenue) and the aforementioned drop in Wii software sales, the Xbox 360 and PlayStation 3 contributed more to software's average selling price. According to Pachter, software reached an average price of $41.17 in May 2010, its highest value so far this year.
While the Wii may be slowing down, the platform has still moved a tremendous amount of software in its time on the market. To get a handle on just how much Wii software has been sold at retail so far in the United States, we looked at the tie ratio figures for each of the current-generation consoles, provided exclusively to Gamasutra.
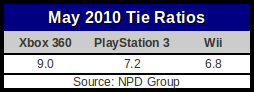
As the Xbox 360 has been on the market for a year longer than the other two platforms, it makes sense to compare to its tie ratio in May 2009, which we estimate was around 8.4.
Anita Frazier, analyst for the NPD Group, cautioned that these figures “do not make an allowance for the Wii Sports pack-in with the hardware”. It also will not include the copies of Wii Sports Resort bundled with newer Wii hardware.
Utilizing these figures and the sizes of each platform's installed hardware base, we can estimate each system's total software sales. To produce the table below, we've drawn on tie ratio figures released by the NPD Group and hardware manufacturers over the past several years.
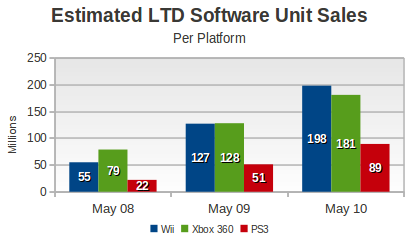
Around May 2009, about the same number of units of Wii software had been sold as Xbox 360 units, despite the latter platform having had an additional year on the market. Now in May 2010 the Wii appears to have a lead of around 17 million units. During the same period, the PlayStation 3 has fallen further behind both platforms.
Even if the PlayStation 3 software situation has changed, and the Wii has also slowed down, Sony's platform has a long way to go before it looks more comparable to its peers in the total software sold.
Finally, we examined a metric we first encountered in the posts of NeoGAF poster JoshuaJSlone: average weeks per game purchase. The basic idea is to estimate how often owners of a particular platform purchase a new game, estimated by dividing a platform's total software sales by the number of weeks of ownership for each platform (computed as the convolution of the installed base p(t) with the linear function t).
Before giving the results of these calculations, be aware that these figures will almost always increase as a system ages. So for a new system with an energized base of owners, the average time between new software purchases may be very short. Obviously, in the long run, when a system nears the end of its life, the average time between purchases will grow longer.
From our calculations, each Xbox 360 owner had been a buying a new game on average every 8.1 weeks in May 2008. By May 2010, that had increased to 12.2 weeks (for the entire population of Xbox 360 owners, measured from the time of the system's launch).
The same metric applied to the Wii showed that its base of owners had been buying a new game every 6.7 weeks on average in May 2008, but that the time between purchases had grown to 12.3 weeks as of May 2010. The same figures for the PS3 are 7.6 in May 2008 and 11.1 in May 2010.
Along with all the other metrics we've examined above, the figures above lead one to the same conclusion: Wii software sales are slowing down, and they're slowing down more quickly than they are on other platforms.
The bottom line on 2010 software: By several measures – year-over-year growth, tie ratios, and weeks per game purchase – the Wii software market appears to be slowing dramatically. This has contributed to the decline in revenue in the software segment, even as the PlayStation 3 has increased its marketshare and offset some of the losses due to the Wii. The Xbox 360 continues to reliably generate software revenue.
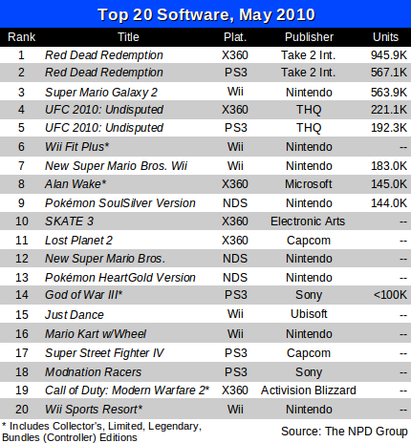
Top-Selling Software for May
On Friday the NPD Group released its list of the top 20 best-selling games for May 2010, and since that time some additional information has become available.
According to Wedbush's Pachter, 13 titles sold over 100,000 units during the month of May, up from 10 such titles a year ago but down from 14 titles in April 2010.
Further details about notable titles that didn't make the chart have been released to media by the NPD Group and commented upon by analysts:
The racing title Blur, created by Bizarre Creations and published by Activision Blizzard, sold only 31,000 units during the May period measured by the NPD Group.
This includes only five days of sales, only for the Xbox 360 and PlayStation 3, but the figure still falls well short of expectations. Last year Activision had said that it expected Blur to do “for racing what Call of Duty did for shooters”Split/Second, a separate racing title created by Black Rock Studio and published by Disney Interactive Software, sold somewhat better with a combined 86,000 units in 12 days for the Xbox 360 and PlayStation 3.
Remedy's Alan Wake, an Xbox 360 exclusive published by Microsoft Game Studios, sold 145,000 units during the May period.
UbiSoft's Prince of Persia: The Forgotten Sands, sold fewer than 100,000 units across five platforms in 12 days, what Wedbush's Pachter termed a “difficult debut”.
Notable titles from last month's chart that failed to return in May include UbiSoft's Splinter Cell: Conviction (#1 in April) and Battlefield: Bad Company 2 (previously at #7 and #15).
An elaborated chart can be found below:
Where Does the Retail Industry Go From Here?
There is palpable tension between the exuberance of the E3 2010 trade show held just weeks ago and the uncomfortable reality of May 2010 sales. We have seen above that hardware sales are declining and that software revenues and unit sales have not lived up to expectations.
We've also seen that changes in the Wii market are driving much of the turmoil here, but when titles like Blur and Alan Wake fail to ignite robust sales, one cannot simply lay the blame at Nintendo's feet.
That is, we have seen what internal figures have made 2008 different from 2009 and 2009 different from 2010, but there are still serious questions about what is driving consumer habits and how to attract those consumers in the near future.
We won't pretend to have answers, but we can elaborate on the opinions we've seen and the ones we hold.
The video game industry is in a transitional state. Consumers have more choices than ever before, and what used to be a relatively straightforward packaged software model has been supplemented (not necessarily supplanted) with mobile games on iPhone and smartphones, casual (web-driven) games, and even traditional consoles and handhelds with direct online distribution.
For example, just last week Sony began PlayStation Store sales of LittleBigPlanet and inFamous, PlayStation 3 games that were previously available only on Blu-Ray media.
While distribution channels have changed, ideal timing in the packaged goods channel remains elusive. In 2008 a packed holiday season was blamed for lackluster sales of titles like Dead Space and Tomb Raider: Underworld.
When publishers shuffled their launches to avoid Call of Duty: Modern Warfare 2 in late 2009, the release calendar for the first half of 2010 became similarly crowded. We expressed concern about this (belatedly) when we wrote that “we don't want a repeat of Fall 2008 situation, where even deserving games got passed over by overwhelmed consumers.”
Mediocre sales of games like Blur and Prince of Persia: The Forgotten Sands will have to have consequences. Watch what third parties like Activision Blizzard and Ubisoft do in the coming months; their actions will show what lessons they've drawn from the difficult first half of 2010. At some point, a first-party publisher -- and the third-party companies supplying the games -- may look at sales of an exclusive like Alan Wake or Heavy Rain and change their philosophy on what they are willing to do for exclusivity.
In parallel to reconsidering what kind of games to make and how to make them, developers and publishers are also experimenting with ways to monetize a game sale far beyond the first week or even the first month. Activision Blizzard is clearly the example, with Modern Warfare 2 continuing to draw revenue from map packs half a year after release, and World of Warcraft continuously drawing on subscriptions and microtransactions.
In fact, it is the Modern Warfare 2 effect that Wedbush's Pachter feels is a dominant effect on the market today, because its multiplayer component is occupying the time of the hardcore videogame consumers, going so far as to say that June 2010 sales could “slide into negative territory”.
Multiplayer and DLC also figures into the creation of EA's Online Pass, a $10 code that enables online features and bonus content in used games. The release of UFC 2010: Undisputed by THQ marks their entry into similar territory, as the game requires consumers who obtain the game secondhand to purchase of a $5 code to access all the game's content.
These moves are also intended to cut off some product from entering the used game market. Doug Creutz of Cowen & Co. recently published research demonstrating that the used game market, especially GameStop, could be a key reason for what he saw as the underperformance of Xbox 360 and PlayStation 3 software in the past couple of years.
And just on the horizon are Kinect and Move, the new motion sensing technologies from Microsoft and Sony, respectively. Into the mix we can also throw the 3D technologies put forth by both Nintendo (with its Nintendo 3DS handheld) and Sony (with 3D glasses technology, compatible with the PlayStation 3 and some televisions).
Each of the factors above is itself a smaller part of the larger video game market: expanding distribution channels, underperforming AAA games, long-term monetization, conflict with the used game market, and untested new technologies. In our view, the path ahead is as unclear as it has been in a long while, and we look forward to studying whatever industry emerges from this transition period, even as we continue to ask what makes it work.
[As always, many thanks to the NPD Group for its monthly release of the video game industry data, with a special thanks to David Riley for his assistance and Anita Frazier for her analysis. Additional credit is due to Michael Pachter, analyst for Wedbush Securities, for his perspective and willingness to answer inquiries. Also we consulted the comments of Doug Creutz of Cowen & Co. in the preparation of this report, and greatly appreciate his insights. Finally, many thanks to colleagues at Gamasutra and particularly regular commenters on NeoGAF, in particular JoshuaJSlone, for many helpful discussions.]
Read more about:
FeaturesAbout the Author(s)
You May Also Like


.jpeg?width=700&auto=webp&quality=80&disable=upscale)


