
Trending
Opinion: How will Project 2025 impact game developers?
The Heritage Foundation's manifesto for the possible next administration could do great harm to many, including large portions of the game development community.
Gamasutra analyst Matt Matthews examines trends in the first six months of U.S. physical video game retail for 2011, and in light of increasingly-important digital models asks the broader question, "Is the video game industry declining?"

[Gamasutra analyst Matt Matthews examines trends in the first six months of U.S. physical video game retail for 2011, and in light of increasingly-important digital models asks the broader question, "Is the video game industry declining?"]
Last Thursday the retail-tracking NPD Group released its latest estimates of the hardware and packaged software market in the United States. The headlines were dire: total sales down 10% with total software down 12%.
The declines were not unexpected, since analysts like Cowen and Company's Doug Creutz had anticipated precisely that decline in software sales prior to the release of the official figures. Wedbush's Michael Pachter expects sales to be down for the remainder of the summer, with the industry recovering when titles like Battlefield 3 and Call of Duty: Modern Warfare 3 are released later this year and hardware vendors like Microsoft and Sony possibly entice consumers with console price cuts.
We would add that there are some positive trends visible in the mass of data for the first half of 2011, and we have tried to illuminate those trends below. In particular, we will show that two segments of the industry (hardware and accessories) have actually grown in terms of revenue so far in 2011.
Further, software unit sales for the Wii may have declined this year, but Xbox 360 and PlayStation 3 software sales have made up for the loss. Finally, the NPD Group's latest extra-retail estimates appear to show very robust growth in non-traditional video game content markets, and some of that growth does appear to be offsetting the weakness at retail.
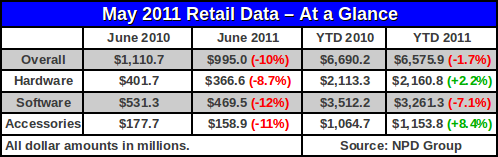
Looking first at just the monthly figures for June 2011, the market was down across every segment compared to the previous year. Even the accessory segment, which was a bright spot from January to April, slowed for the second month in a row. We are further alarmed that accessories were down by 11%, erasing a good chunk of the gains made during the first quarter of the year.
Hardware revenue fell by over $30 million in June, a decline of 9%, while software saw a decline of $60 million or 12%. Total hardware units also fell, from nearly 1.9 million to just over 1.7 million, but the decreasing of importance of the less expensive platforms (Sony's PlayStation 2 and PlayStation Portable, specifically, but also Nintendo's Wii) means that the average price of a system sold in June 2011 is actually higher than it was in June 2010.
The year-to-date figures are slightly more encouraging, as they include several months earlier in the year when the results were more positive. In particular, total hardware revenue in 2011 is up slightly to $2.16 billion, an increase of over 2% from the same time in 2010. Total hardware units were down from 10 million in 2010 to 9.5 million this year, again showing that average hardware prices have increased.
The accessory segment in 2011 is up 8.4% from 2011, to a total of $1.15 billion, while software is down overall to $3.26 billion.
The table below breaks out the revenue figures for ease of comparison.
The NPD Group is now clearly labeling their media releases to separate retail revenue figures from video game content sold through other means. They are providing quarterly estimates of those extra-retail sales, including mobile games, downloadable content, and casual games, along with other segments, but those figures are not included in the figures above, although we do consider those figures in a later section.
We estimate that 86 – 87 million units of software have been sold so far this year, down from nearly 90 million at the same point last year. By our estimates, the average price of a unit of software sold in the first six months of 2011 is over a dollar lower than it was during the first six months of 2010.
We asked Wedbush analyst Michael Pachter about this decline in the average price of software, and he remarked that it was mostly due to the mix of software titles that make up the monthly figures. In particular, the industry “[hasn't] had the big hits first half” of 2010 when titles like God of War III and Red Dead Redemption launched.
In that same vein, we would note that LucasArts has had great success in 2011 with its LEGO titles which have appeared in the NPD Group's monthly top 10 list for four months straight (including both LEGO Pirates of the Carribean and LEGO Star Wars III: The Clone Wars on the May chart). Moreover, Take-Two Interactive has seen its NBA 2K11 title in the top 10 every month this year, a remarkable feat for a sports title.
Activison's Call of Duty: Black Ops has also charted every month in 2011. Ubisoft's Just Dance 2 for the Wii is exceptional for being the only single-platform title to appear five times in the top 10 chart so far this year.
Finally, before we look at the details underlying software sales and the extra-retail sources of revenue, we consider two other visualizations of sales during the first-half of 2011. Our first figure shows hardware sales for each major platform during the first half of 2011.
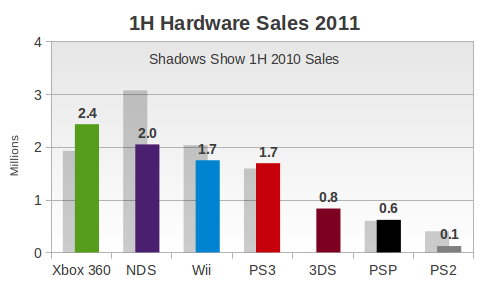
The shadows behind each colored bar represent sales from the first half of 2010, for the sake of comparison. As the Xbox 360 and PlayStation 3 continue to grow, the former far more quickly than the latter, every other key platform declined. We are intrigued that hardware sales for the PSP appear to have been essentially flat compared to last year, a result we did not anticipate, even after the price cut in March.
And to put the full revenue picture into perspective, we return to one of our standard graphs that shows industry revenue for each year from 2005 to the present.
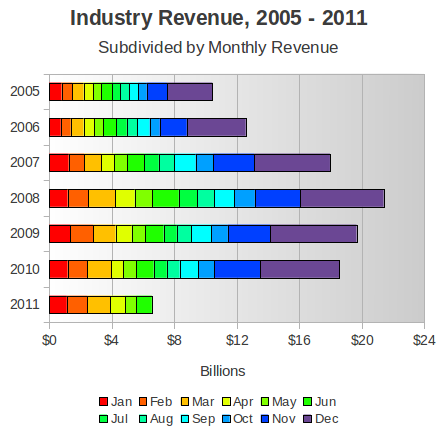
As the diagram shows, the revenue so far in 2011 is on par with 2010 and ahead of what the industry produced in 2007, but it still lags far behind the record revenues of 2008 and 2009. We will try to address this disparity more below when we explain how we might begin to account for that revenue through extra-retail sources.
During the initial rush for the Nintendo Wii, retail sales of hardware and software were both exceptionally high. To demonstrate just how hot Wii software got at the beginning, let us review some historical figures.
From January to June of 2007, over 2 million Wii systems were sold (bringing the installed base to just over 3 million) and, by our estimates, nearly 8 million units of software were sold.
During that same January – June 2007 period, only 1.25 million Xbox 360 consoles were sold (bringing its installed base to 5.8 million) but software sales reached over 11 million units. At this point, more Xbox 360 software was being sold than Wii software.
Within a year, however, the Wii's hardware base would more than triple and its software sales during the January – June 2008 period would more than triple the 2007 rate. By the end of June 2008, the Wii had just surpassed the installed base of the Xbox 360 (despite the latter system launching a full year earlier) and its software sales were 30% higher on that comparable installed base.
The figure below shows our estimates for first-half retail software sales for the Nintendo Wii, Microsoft Xbox 360, and Sony PlayStation 3 for each year from 2007 to 2011. It represents a composite of data from a variety of sources, including official NPD Group data, company press releases, and data presented to investors by Nintendo.
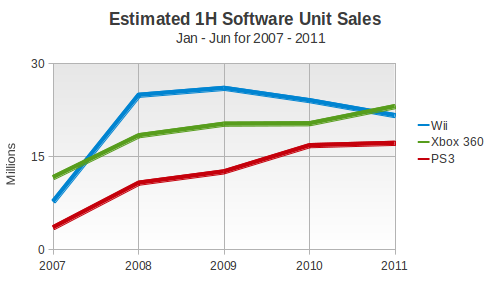
As the figure above shows, PS3 and Xbox 360 software unit sales during the first six months of each year have each trailed behind the total for the Wii up until 2011. We have known for some time that Wii software was declining year-over-year on a dollars basis, but this is the first clear look at Wii software unit sales falling below Xbox 360 software unit sales during a six-month period after 2007.
There are two dynamics at play here, and each is notable for what it suggests about the remainder of 2011.
First, we continue to believe that Wii software sales were and are driven by new Wii owners, those who have obtained a Wii in the last six months. So the outstanding increase in the Wii installed base from 2007 through 2009 drove the system's corresponding outstanding software sales. Since that period, however, its hardware sales have cooled and so have its software sales, and we expect this trend to continue throughout 2011. While Nintendo is still capable of surprising us, the Wii software release slate through the next year looks insufficient to slow the erosion of the platform's software sales.
Second, Microsoft appears to have found a winning formula for promoting not only sales of its hardware but also software. Without an explicit price drop, Microsoft has produced year-over-year increases in Xbox 360 sales for every month so far this year, for a cumulative year-to-date increase of 26% over 2010. (The figure below shows hardware sales in the first half of each year from 2007 to 2011.)
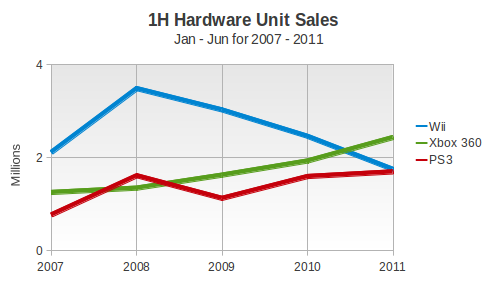
There have been ongoing offers at retailers involving gift cards, and in particular a recent deal offering an Xbox 360 with the purchase of some Windows 7 computers. While the effect of that latter deal is difficult to assess, it did apparently give a small lift to sales in June according to Wedbush analyst Michael Pachter. In his opinion, the difference wasn't close to changing the ranking of the consoles for the month, where the Xbox 360 was about 228,000 units ahead of the second-best PlayStation 3.
Without any change in these two trends (weakening Wii sales and a strong Xbox 360), it seems quite likely that the Xbox 360 will be the top-selling console during all of 2011, by most any measure, units or dollars, hardware or software. Moreover, the gap between the total software units sold for the Wii and for the Xbox 360 is now shrinking. At the end of 2010, the Wii had a lead of nearly 17 million units over Microsoft's console, but that has now shrunk to just above 15 million units. It is conceivable that the Xbox 360 will end its run in the United States having sold more units of software than the Wii.
Before leaving the subject of console hardware and software, we should note that the PlayStation 3 has had its best opening half of a year ever, with hardware sales near 1.7 million units (up 6% over 2010) and software sales up slightly (just over 2%). If Sony had had a hit on the order of 2010's God of War III to bolster its software lineup, it would have probably done better, but instead had scheduled lower-key releases like LittleBigPlanet 2 and inFamous 2, each a sequel to a new property, and each of which charted in the top 10 for its respective launch month.
Back in late 2009, Wedbush's Pachter made headlines with his observation that persistent year-over-year declines in monthly software sales could be “leading investors to believe that the industry is in a state of secular [long-term] decline”. A full 18 months have passed since that time, and those monthly software sales declines outnumber increases by 13 to 5.
In the meantime, much has been made of the industry's attempt to monetize the online space where several casual, social, and free-to-play games have become successful. See, for example, the recent $750 million acquisition of PopCap games by megapublisher Electronic Arts. Simultaneously the market for apps on mobile devices such as phones and tablets has come into its own as a part of the entertainment content market.
What has not become clear is how much these two opposing trends – the decline of the traditional retail market and the rise of the digital goods market – have offset each other. Is the overall video game market growing or contracting? At what rate is it changing?
The NPD Group has tentatively stepped into the breach with its Games Industry: Total Consumer Spend report. While we are not privy to the full report, the NPD Group did release some details publicly, and we have enough information to piece together a slightly more detailed picture of the full market.
Consider the figure below, which breaks out first quarter of all video game industry sales in 2010 and 2011, as estimated by the NPD Group. The figures include retail console software sales, retail handheld software sales, retail PC software sales, and all other forms of content sales. That final category covers several sources: used games, rentals, subscriptions, digital download, social networking, DLC and mobile games.
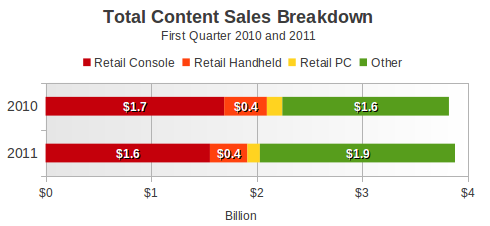
According to the NPD Group's figures, the total money spent on video game content in the first quarter of 2011 grew to $5.9 billion, a 1.5% increase over last year's first quarter result. Given what is known about the size of the retail market, and the fact that it contracted from $2.2 billion in 1Q 2010 to $2.0 billion in 1Q 2011, we can say that all of those other dollars spent on video game content grew from $1.6 billion to $1.9 billion in the same timeframe.
That is, while the traditional retail market lost 10% of its value, the rest of the market grew by about 17%. It is that 17% increase that drove the modest 1.5% increase in the total amount spent on video game content.
Unfortunately, that money is not all spent on new games. Since used games are included in that other category, some of the money in that $1.9 billion does not directly benefit video game developers and publishers. We estimate that about 1/5 of the $1.9 billion figure includes money spent on used games, based on what is known about GameStop's used product revenue figures. (Other retailers participate in used video game sales, but we believe that those other used video game programs are much smaller.)
Regardless, the rate of increase in used game sales at GameStop is slower than the 17% for the entire “other” category, and therefore money on subscriptions, digital download, social networking, DLC and mobile games is actually growing much more quickly.
Taken as a whole, we believe that sales of new content – both at retail and outside of retail – are indeed growing. However, it will take regular measurements from the NPD Group's reports to assess just how quickly, and whether the erosion at retail satisfactorily be replaced with other sources of sales. Moreover, it would be helpful to see companies like Sony, Nintendo, Microsoft, Electronic Arts, and Activision express their sense about the reliability of the NPD Group's claims.
Finally, we would like to add that we believe the retail business is doing reasonably well given the slowdown in Wii software sales and the utter collapse of the music game genre. In 2008 the music game segment generated $1.6 billion in revenue at retail as part of the new software segment. That figure dropped to under $900 million in 2009 and below $300 million in 2010.
Now, look at the following figure, which shows the trailing-twelve-month (TTM) total software sales for the handheld and console markets. (For example, the data point above June 2011 represents the sum of all software revenue from July 2010 through June 2011.)
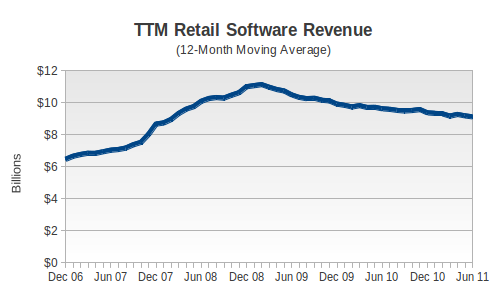
The software segment has lost $2 billion in annual revenue between February 2009, when the TTM total reached $11.1 billion, and today. A majority of that loss could be directly attributed to the loss of revenue from the music game segment alone. For an industry recovering from that kind of burst bubble, the decline in revenues has been relatively gentle, if still uncomfortable.
[As always, many thanks to the NPD Group for its monthly release of the video game industry data, with a special thanks to David Riley. Thank you in particular to NPD Group analyst Anita Frazier for her monthly analysis notes, and to Liam Callahan for his added insight.
Additional credit is due to Michael Pachter, analyst for Wedbush Securities, for his perspective, instrucive conversations, and entertaining anecdotes. We also drew on the comments of Doug Creutz of Cowen and Company, and wish to thank him for his perspective.
Finally, many thanks to colleagues at Gamasutra and particularly regular commenters on NeoGAF for many helpful discussions.]
Read more about:
FeaturesYou May Also Like