


Trending
Opinion: How will Project 2025 impact game developers?
The Heritage Foundation's manifesto for the possible next administration could do great harm to many, including large portions of the game development community.
In Gamasutra's latest analysis of U.S. console game retail trends, Matt Matthews examines why industry growth may finally kick in during March, while also examining music game sales and intriguing hardware trends for February 2010.

[In Gamasutra's latest analysis of U.S. console game retail trends, Matt Matthews examines why industry growth may finally kick in during March, while also examining music game sales and intriguing hardware trends for February 2010.]
Analysts had expected the February 2010 U.S. retail video game sales figures to show yet another year-on-year decline, and indeed revenue was down a dramatic 15% according to the official figures published by the NPD Group last week. Only one month in the last twelve has shown measurable growth. Ten months showed contraction, and in the remaining month growth was less than 1% or essentially flat.
Obviously, it's believed that the online game market is seeing significant growth, thanks to the rise of web-based and social network online games, as well as digital distribution in general.
But the conventional wisdom holds that the retail industry will return to growth in March 2010. Below we'll examine this claim and some evidence justifying this optimism, with important factors like the music game genre and installed hardware bases.
We'll also examine the shifting hardware landscape, revealing updated figures for Nintendo DSi sales and our first reasonably hard estimate of how well the PSP Go hardware is selling relative to the standard PlayStation Portable hardware model.
As hardware prices are cut, the retail game industry will increasingly rely on increased software sales to drive revenue growth. To that end, we'll examine software unit sales and pricing and examine one analyst's claim that the Wii market has become more selective – i.e. casual – in the past few months.
Retail video game revenues dropped to $1.26 billion in February 2010, a loss of $222 million (or 15%) compared to the same month in 2009. The majority of the loss was roughly shared between the hardware segment (down $108 million) and the software segment (down $112 million).
Hardware unit sales were down over 300,000 units across the six key platforms. The Wii alone saw a drop from 753,000 units in February 2009 to 398,000 units in 2010, a difference of 355,000 units. Nintendo has claimed some of the decline is due to “continued product shortages”. The only other platforms to show declines were Sony's PlayStation 2 and PlayStation Portable (PSP).
Furthermore, hardware revenues were further hit by lower average prices for each platform in 2010. Recall that every system, with the exception of the Nintendo DS, has seen a price cut of some sort in the past year.
Software unit sales dropped precipitously, from over 19 million units in February 2009 to just over 16 million units in 2010. This drop was offset somewhat by a rise in average software prices, one of the few bright spots in the month's figures.
As has been the case consistently for months, the accessories segment of the industry was least affected by the downturn. Revenue in that segment was essentially flat for the month and year-to-date.

Please note that all the NPD Group data presented here covers only retail sales. Subscription fees and revenue generated through console and handheld storefronts, like Xbox Live Arcade or the PlayStation Store, are not covered.
One could be excused for doubting the prospect of industry growth in March by looking at the last two months. After all, January 2010 was down 13% compared to January 2009 and February was down 15%.
The important context here is that the retail industry, measured by the data provided by the NPD Group, changed dramatically between February and March 2009. According to NPD Group data for 2009, software sales dropped from 4.9 million units per week (on average) in February to 3.9 million units per week (on average) in March.
Moreover, average hardware sales dropped to 400,000 systems per week in March from over 580,000 units in February.
To put it as briefly as possible, sales at January and February of 2009 were significantly higher than they were in March.
Provided that a similar shock isn't present in the March 2010 sales, the figures so far this year clearly lead one to expect that its revenues will exceed those weaker March 2009 revenues.
The figure below demonstrates this concept graphically. The blue bars represent average weekly revenue for months in 2008 while red bars represent the analogous figures for 2009.
Where the red bars are higher for January and February 2009, the industry was growing. However, starting in March the red bars are shorter than the blue bars, and the industry was contracting.
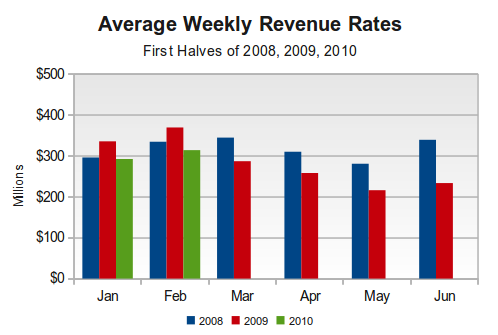
Look closely now at the January and February 2010 revenues – represented by the green bars. Should a similar revenue rate hold through March 2010, the green bar for March will be taller than the red bar, and therefore the industry will experience growth. (You can click here to see to see a short animation annotating the above graph.)
Under that scenario, revenue for the first quarter of 2010 would be down a modest 6% over the first quarter of 2009. Maintaining that level of revenue through the end of June would result in the industry being down a very reasonable 3% compared to the first half of 2009.
To put this in context, the following figure shows the growth rates each half since the beginning of 2006. A decline of only 3% would be right in line with the slight recovery the industry experienced in the latter half of last year.
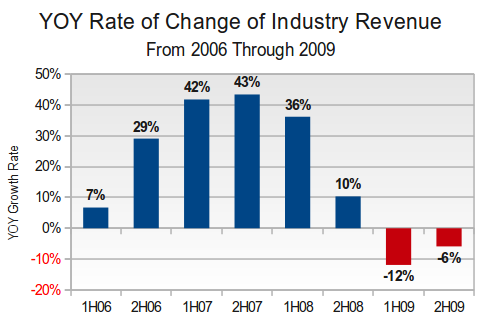
(For the calculus-inclined, the above graph is similar to a first derivative of revenue, to the extent that average rate of change is similar to instantaneous rate of change. A less negative first derivative is an improvement.)
Outside of these trends, there is the packed software slate for the coming months. With Final Fantasy XIII (Xbox 360, PS3), Battlefield Bad Company 2 (Xbox 360, PS3), God of War III (PS3), and Pokémon Soulsilver/Heartgold (NDS) all due out in just March, there is plenty of reason to expect software unit sales and revenue both to move upward.
One factor we don't see discussed much, but which we find interesting, is that software unit sales seem disjointed from the increasing installed hardware base.
In particular, in February 2009 there were nearly 41 million current-generation consoles (Xbox 360, Wii, and PlayStation 3). In that month revenue for those platforms totaled over $550 million.
Yet in February of this year, there are nearly 60 million current-generation consoles – a nearly 50% increase in 12 months – and the same platforms generated 9% less software revenue.
Michael Pachter, an analyst for Wedbush Securities who covers the videogame industry, has pointed to the music game genre as part of the big shift. We agree – just look at the figures below – but we feel compelled to point out that the music game genre was already suffering losses in early 2009.
The figure below shows estimated revenues for Rock Band and Guitar/DJ/Band Hero series for the first two months of each of the years 2008, 2009, and 2010, according to Wedbush's Pachter. Notice that from 2008 to 2009 the total genre would have seen a decline of around $85 million in revenue.
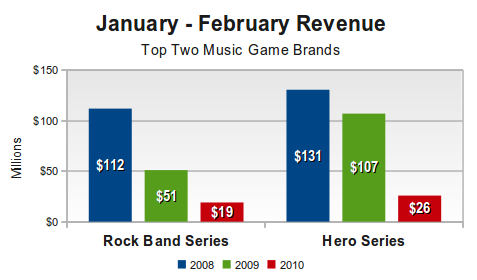
Yet February 2009 was a month in which total industry revenues grew, and software revenue itself grew by nearly 9%. Some of this could be attributed to sales of higher-priced bundles – remember that Guitar Hero III selling in early 2008 had only included guitars while Guitar Hero: World Tour selling in early 2009 included guitars, drums, and microphone bundles. But in fact, the average price of software in February 2009 dropped, so the prices can't explain everything.
Somehow in 2009 the industry more than made up for a loss of $85 million in music genre contraction. With a 50% larger base of current-generation console hardware, why wasn't the same possible in 2010?
It has been several months since we examined the hardware market in the detail, and there are many trends worth examining in that segment.
There are currently 10 different major hardware models on the market across six platforms, and for the first time we wish to provide a one-month snapshot of how we believe each model is selling relative to all the others.
Before showing our estimates, however, we wish to make a few points clear. First, the NPD Group does not provide the level of detail that we are attempting to extrapolate here.
Second, we decline to consider the effect of retailer promotions on pricing, and use only the standard prices set by the manufacturers.
Finally, we have made what we feel are reasonable assumptions about the PSP market to arrive at our PSP Go sales figure.
With that said, based on pricing data provided to us by the NPD Group, the figure below shows what we believe is an approximate breakdown of hardware model sales for the month of February 2010.
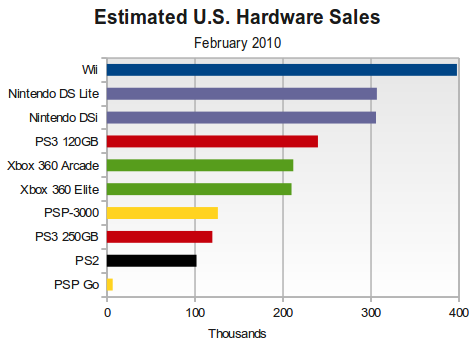
There are several notable points on this graph, but we'll start with the one we find most interesting: the PSP Go. By our estimation, between 6,000 and 10,000 PSP Go systems were sold in February 2010.
According to official data, the average price across both PSP models in February 2010 was only $185. The PSP-3000 is currently available both in a standalone package for $170 and in bundles for $200. The standard PSP Go is priced at $250. Given the three configurations, it is difficult at best to gauge how much each system contributes to the average price but some modeling provides a bit of insight.
For example, given the standard prices, it is effectively impossible for the core $170 package to account for less than 50% of PSP hardware sales. In fact, between 50% and 80% of all PSP systems sold in February were this base model.
The same model reveals that 0% – 50% of all PSP systems sold in February were hardware bundles, priced at $200. The remaining were PSP Go systems.
According to figures provided to us in late 2007, it appears that consumers have often found the PSP hardware bundles quite attractive, with those models even outselling the core system in some months. For this reason, we believe that bundles accounted for 40% – 45% of all PSP system sales in February 2010.
Consequently, the model shows that the PSP Go would account for between 5% – 10% of all PSP systems that month. Again, we stress that this is an educated guess based on some hard data and some experience, and would welcome the release of harder figures from Sony.
With PSP Go sales this low, and the PSP-3000 itself demonstrating historically weak sales, we feel even more confident in our conclusions from last month: Sony will replace the PSP with a successor platform, possible announcing its intentions sometime in 2010. Beyond that, we expect the PSP Go to experience a slow death at retail.
As for Sony's other modern system, the PlayStation 3, the average price provided by the NPD Group reveals that approximately two $300 models (with a 120GB hard drive) were sold for each $350 model (with a 250GB hard drive). Sony has claimed hardware shortages, and ironically that is good news in light of our sales estimates.
If the $300 PS3 is outselling each of the $200 Xbox 360 Arcade and the $300 Xbox 360 Elite, as our estimates suggest, then that means that Sony has successfully made its case to the consumer for the price/value ratio of its system.
This doesn't mean that it's beating the Xbox 360 – Microsoft's two models are still collectively outselling the PS3 – but rather that consumers have embraced Sony's system alongside Microsoft's.
In fact, we would argue that Microsoft's Xbox 360 itself is doing quite well for a system in its fifth year. The company has increased sales each February since the system's launch, and the strong software offerings this year – including a new Halo title – should help propel the platform through the rest of 2010.
We remain dubious on whether Microsoft's Project Natal will actually lift and sustain the platform significantly, but are open to the possibility that the motion controls along with a $50 price cut might welcome more casual players into Microsoft's fold.
According to the average prices provided by the NPD Group, we estimate that the Nintendo DSi still accounts for about 50% of all Nintendo DS sales. That represents no change from the situation in October 2009, when we last got a read on DSi sales. We expect that the installed base for the Nintendo DSi now stands in the neighborhood of 5.8 million units or around 15% of the total Nintendo DS hardware base.
This is the last month in which Nintendo DS sales will be this easy to interpret. On 28 March Nintendo will launch the Nintendo DSi XL at a price of $190. Should that revision be even half as successful as the Nintendo DSi, the average price of Nintendo DS systems being sold in the U.S. will probably have risen by mid-year, an amazing feat for a platform now in its sixth year.
Earlier we noted a drop in total software dollars for the current-generation systems – the Wii, Xbox 360, and PlayStation 3. However, there is more detail within those figures that is worth examining.
As Michael Pachter has noted over the past few months, software sales on the Xbox 360 have remained flat relative to the same period last year while PlayStation 3 software sales have experienced solid double-digit gains.
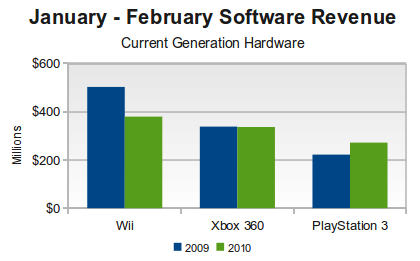
Simultaneously the year-to-date revenue for Wii games is down nearly 25%, from $500 million to around $380 million.
At least $60 million of the difference can be accounted for by the drop in demand for Wii Fit and Wii Fit Plus. In fact, across Nintendo's key evergreen first-party franchises, it appears that sales are beginning to weaken somewhat.
(Some analysts believe that this may actually be due to shortages of hardware-reliant Wii SKUs such as Balance Board and MotionPlus devices, but we'll know more about this as the year continues if we see a bounceback.)
The graph below shows just how the January – February software revenue picture has played out in 2009 and in 2010.
(Note that the overall rankings remain the same (that is, the Wii is still leading the Xbox 360, which is itself ahead of the PlayStation 3), but the race has tightened significantly.)
Pachter raises a red flag on the Wii's software picture, saying that the problem “runs deeper” than just the recent hardware declines. He observes that Super Mario Galaxy 2 is the only major software release in the near term, and that he believes that Wii owners have become more discriminating about their software purchases (as shown in the recent weaker sales of previously robust titles like Wii Fit and Wii Play). Moreover, he notes that the Wii software tie ratio is declining over time – an indication that hardware purchases are ahead of software.
This last point – on the tie ratio – deserves a bit of explanation. For a system like the PlayStation 3 where hardware sales are rising quickly year-over-year, a declining tie ratio is to be expected. But if Pachter in fact means that the Wii tie ratio is declining through January and February of 2010 – a period when its hardware sales are down year-over-year – then that means that software sales are also falling, and perhaps quite dramatically.
This is where one could make an argument that a different mix of first- and third-party software, like what one finds on the Xbox 360 or the PlayStation 3, helps smooth out some of the software dynamics from month to month.
As an example, we know that 95% of the Xbox 360's software revenue during 2010 has come from the sale of third-party software. Contrast this with the situation the Wii, where we can estimate that at least 33% of software revenue in 2010 has come from first-party titles, based only on the titles appearing in the top 20.
It is no surprise, therefore, that Microsoft is keenly focused on making third-party publishers welcome on its platform. In a month when third parties falter, so too will Microsoft's software revenues and thus Microsoft's licensing fees. In early 2010 we are seeing that Wii software sales have dropped, probably driven by the slowdown in first-party Wii software titles.
We expect that Sony's software mix falls somewhere between these two extremes. After all, it had three first-party titles in the top 20 in February, and will no doubt add God of War III in March.
Meanwhile, as on the Xbox 360, third-party titles like Modern Warfare 2 and BioShock 2 continue to sell reasonably well on the PS3. Unfortunately for Sony, they still have the lowest software revenue overall, which is a humbling position for the company that led so decisively during the PlayStation 2 era.
So as Sony and Microsoft ramp up their motion control platforms later in 2010 and the Wii consumer (presumably) becomes more discerning, there is at least some possibility for a fundamental shift in momentum.
Aggressive cuts by Sony have pushed Microsoft to shuffle the cost of its core hardware. As a result the Wii no longer enjoys the same price advantage that it once had, and soon it will also cease to be the only motion control system on the market.
Should Microsoft or Sony capture any mindshare with the casual consumers brought to the market by the Wii, games like EA Sports Active 2 and UbiSoft's Just Dance could sap some of the sheen of exclusivity previously held by the Wii.
[As always, many thanks to the NPD Group for its monthly release of the video game industry data, with a special thanks to David Riley for his assistance and Anita Frazier for her analysis. Additional credit is due to Michael Pachter, analyst for Wedbush Securities, for his perspective and information. Finally, many thanks to colleagues at Gamasutra and commenters on NeoGAF for many helpful discussions.]
Read more about:
FeaturesYou May Also Like