Trending
Opinion: How will Project 2025 impact game developers?
The Heritage Foundation's manifesto for the possible next administration could do great harm to many, including large portions of the game development community.
In a Gamasutra-exclusive analysis, we analyze U.S. game hardware and software numbers for the whole of 2008, discovering surprising multi-year growth comparisons and marketshare changes.

[In a Gamasutra-exclusive analysis, we analyze U.S. game hardware and software numbers for the whole of 2008, discovering surprising multi-year growth comparisons and marketshare changes.]
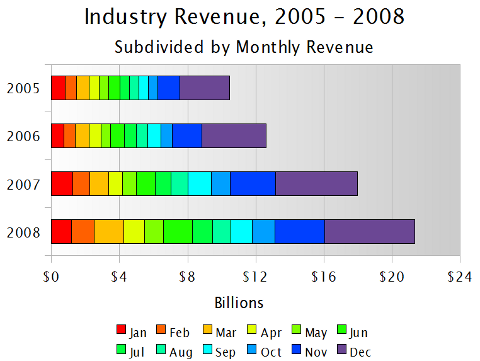
The United States videogame market grew to $21.3 billion in 2008 according to industry figures released by the NPD Group on Thursday of last week. That marks a nearly 19% increase over the previous record of $18.0 billion set in 2007 and a doubling of annual revenue since 2005.
Yet, as industry analyst Anita Frazier noted in comments which accompanied the NPD Group's release, “This is not a case of the rising tide lifting all boats.”
As the figures detailed below will demonstrate, “the increases are not being enjoyed equally by all manufacturers and publishers.”
For yet another month Nintendo's two platforms – the Wii console and the Nintendo DS handheld – dominated hardware sales.
While the 2.15 million Wii systems sold in December was well below many analyst estimates, it was still far ahead of the competition and up 59% year-on-year. For the year, Wii system sales increased to 10.2 million, up from 6.3 million in 2007.
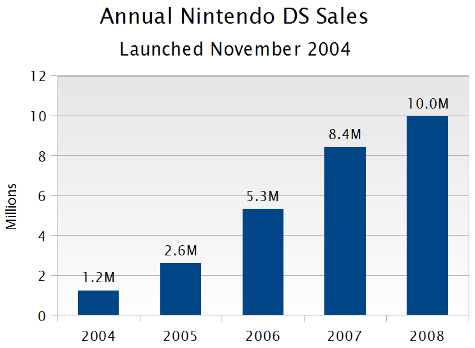
Over 3 million Nintendo DS handhelds were sold during December, and annual DS sales are now as follows:

Nintendo's December DS tally was an industry record for monthly sales of a system in a single month and a 23% year-on-year increase from December 2007. (The previous single-month hardware sales record was 2.7 million systems by Sony's PlayStation 2 in December 2002.)
As for the competition, Sony controls two consoles, the PlayStation 2 and PlayStation 3, as well as a handheld, the PlayStation Portable.
During its eighth full calendar year on the market, 2.5 million PS2 systems were sold, down 36% from 3.9 million in the prior year. Monthly sales in December 2008 fell an even sharper 63% to 410,000.
Here's Gamasutra's specially compiled yearly hardware sales for all systems for 2007 and 2008:

Conversely, the PS3 increased its annual sales from 2.6 million systems to 3.5 million for 2008, somewhat offsetting the loss of PS2 sales. However, PS3 sales for the final month of the year were actually down from 798,000 units in 2007 to 726,000 units in 2008.
Sales of the PSP handheld were flat year-on-year at 3.8 million units, making it the best selling of all three PlayStation systems in 2008.
The third platform holder, Microsoft, saw sales of its Xbox 360 console jump over 14% year-on-year for the month of December, from 1.26 million systems to 1.44 million systems.
However the Xbox 360 was only up from 4.6 million units during calendar year 2007 to 4.7 million during 2008. Without the dramatic increase in sales after Microsoft's August 2008 price drops, the system might well have recorded lower sales in 2008 than in 2007.
According to Sony, over $2.5 billion in PlayStation hardware (PSP, PS2, and PS3) was sold in 2008, or around 32% of all hardware dollars for the year in the U.S..
With the drop in PlayStation 2 hardware sales and a drop in the average sale price (ASP) of PlayStation 3 hardware, it is possible that this dollar figure represents very modest increase from 2007 -- albeit a drop in percentage of marketshare.
By comparison, Nintendo sold nearly $2.5 billion in Wii hardware alone during 2008, with another $1.3 billion coming from the Nintendo DS.
Together, those platforms would account for almost 50% of all dollars spent on hardware for the year. Moreover, Nintendo hardware sales brought in at least $1 billion more in 2008 than in 2007.
As detailed in previous months, cuts in Xbox 360 hardware prices during August have significantly reduced the average sale price for the system.
We still estimate that the Xbox 360 accounted for more than $1.4 billion in hardware sales during 2008, and now averages around $275 at retail.
Given that the average sale price for the Xbox 360, lifetime to date through mid-2008, was over $375, Microsoft appears to have seen higher revenue from hardware in 2007.
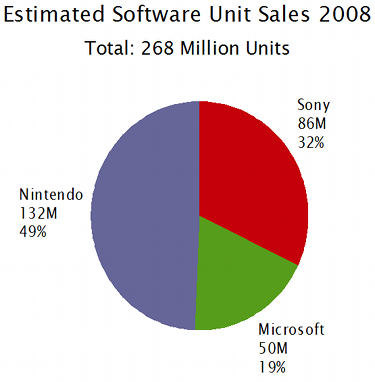
According to figures released by Michael Pachter, analyst for Wedbush Morgan Securities, around 268 million units of console and handheld software were sold during 2008, up 15% from the prior year. On average, 8.5 units of software were sold per second in 2008.
Nintendo revealed in a recent press release that 132 million units of software were sold for its systems during the year, or just over 49% of all software units sold in 2008. Of that 132 million, we estimate that over 70 million were for the Nintendo Wii, and most of the remaining 60 million were on the Nintendo DS -- with a million or so on the Game Boy Advance.
The Wii software tie ratio appears to be approaching 6.0 games per system. Incidentally, Mr. Pachter noted that the Wii accounted for 37% of all software dollars in December 2008, surpassing the record set by the PlayStation 2 in December 2003.
Here's a look at the overall game sales by unit totals, split by hardware manufacturer in 2008, as compiled by Gamasutra from the above information:

Interestingly, Microsoft has often touted the Xbox 360 software tie ratio in its press releases, but declined to do so for December 2008.
While it is often logically dubious to base a conclusion on a lack of information, the absence of a comment from Microsoft and the constant 8.1 tie ratio from September through November leads one to suspect that the system's tie ratio may have remained constant or even dropped slightly in December.
Assuming that the tie ratio did remain constant, Microsoft would have sold around 12 million units of software in December, and in the neighborhood of 48-49 million units of Xbox 360 software for all of 2008, up from around 41 million units in 2007.
According to software sales figures from Sony, it appears that more than 27 million PS3 software units were sold in 2008, or more than double the 12.5 million PS3 software units we estimate they sold in 2007.
With approximately 41 million units of software launch-to-date (LTD), an average 6.0 units of software have been sold per PlayStation 3 system. The remaining 57 million units of software are primarily for the PlayStation 2, with some lesser fraction for the PSP.
According to NPD figures, U.S. consumers spent $10.9 billion on software for consoles and handhelds in 2008, an increase of 26% from the previous year.
Sony has stated that $3.2 billion of software for PlayStation-branded systems was sold during the 2008. Moreover, Microsoft's figures suggest that around $2.7 billion was sold for its Xbox 360 during 2008.
Those figures therefore suggest that Nintendo sold around $4.8-$4.9 billion in software during 2008.
The numbers are consistent with Wii software having an average selling price between $40 and $50 and Nintendo DS software having an average selling price between $20 and $30.
Here are Gamasutra's estimated game sales for each manufacturer, by dollar amount, for the entirity of 2008.
As in the previous chart, this includes both first and third-party game sales:

In January of 2008, a Nintendo press release claimed that Nintendo platforms were responsible for 60% of the industry's 43% growth rate from 2006 to 2007. Given that the industry had grown nearly $5.5 billion in that period, Nintendo was claiming about $3.3 billion year-on-year growth.
Last week Nintendo made a similar claim, and stated that it was responsible for 99% – or about $3.3 billion – of the industry's revenue growth in 2008. The claim about 2007 was remarkable, but to have produced 99% of the entire industry's growth the following year is just short of incredible.
Using data provided by Sony and Microsoft and Nintendo, we can begin to stitch together a full picture of just how the marketshare has changed from 2007 to 2008. The graphs tell the story, although the gory details are provided below.
First, here's the Gamasutra-compiled graph for the 2007 marketshare -- of the game hardware plus first and third party software plus first and third party accessories -- per platform owner.
(Remember that Nintendo's marketshare includes Wii, DS, and trace amounts of Game Boy Advance, Sony's includes PS2, PS3, and PSP, and Microsoft's includes Xbox 360 and trace amounts of Xbox):

Next, here is the graph for the 2008 U.S. marketshare, so we can see some of the notable changes occurring thanks to Nintendo's blockbuster year:

Here's the justification behind these numbers. According to Sony, its platforms accounted for $6.4 billion in all of 2008.
Moreover, for the January through November 2007 period, its platforms accounted for about $4.6 billion of industry revenue, with $1.5 billion more in hardware and software in December 2007. That makes for approximately $6.2 billion in revenue for 2007 after sales of accessories are factored in.
According to Microsoft, the Xbox 360 accounted for $4.8 billion in 2007, and after allowing for software sales for the original Xbox, we estimate it produced $5.1 billion in all of 2007.
Finally, using the known industry totals from 2007 and 2008 ($17.97 billion and $21.33 billion, respectively) we can estimate that Nintendo accounted for $6.7 billion in 2007 and Microsoft accounted for $4.9 billion in 2008.
The key observation here is that Microsoft's marketshare, both in dollars and in percentage, contracted marginally. While Sony's dollar share increased slightly, the total increase in the size of the industry actually resulted in a decrease in its percentage of the market.
All of that lost share, of course, has shifted to Nintendo's column, and the company now appears headed for a nearly 50% share of the market in terms of its own hardware and game sales, plus third parties selling merchandise for it.
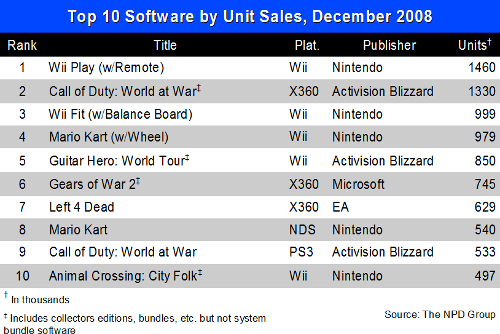
Along with the industry revenue figures, the NPD Group also released two important charts: the top 10 games for December 2008 and the top 10 games for all of 2008.
To begin with we will examine December's top 10. Five familiar Nintendo Wii titles dominate leading software: Wii Play (#1), Wii Fit (#3), Mario Kart (#4), Guitar Hero: World Tour (#5), and Animal Crossing: City Folk (#10).
This marks Wii Play's 23rd straight month in the top 10 and, amazingly, its first appearance as the #1 selling title for any of those months. Wii Fit has been on the chart since May of this year and Mario Kart since April.
Guitar Hero: World Tour for the Wii debuted at #12 on the chart in October, but climbed into the top 10 in November and December. Animal Crossing makes its first appearance in the top 10 after just missing the list the previous month.
Here's the full countdown:

Note that all five of these Wii titles are closely associated with a peripheral pack-in. In the case of Guitar Hero and Wii Fit, the cost of that hardware also increases the price of the title significantly. (Critics will argue the same for Wii Play, which is admittedly an interesting case of bundling.)
Three of the remaining titles are for the Xbox 360 and also appeared in November's top 10: Call of Duty: World at War (#2), Gears of War 2 (#6), and Left 4 Dead (#7).
While the first two of those titles saw drops in sales going into December, the last one – Valve's Left 4 Dead – actually saw an increase of 116,000 units from its November figure.
The lone PlayStation 3 title in the top 10 (and, in fact, in the top 20) was Call of Duty: World at War. Regrettably for Sony's lead platform, sales for the PS3 version dropped more than the Xbox 360 version going from November to December.
Finally, it must be pointed out that Mario Kart for the Nintendo DS has returned to the top 10 chart at the #8 spot more than three years after it launched. According to Nintendo, the handheld racing title has thus far sold 4.3 million units in the United States alone.
Some well-known games did not make the top 10 or even the top 20 for December. In particular, Ubisoft's Prince of Persia did break into the individual platform top 10 lists for the PlayStation 3 and Xbox 360. But it did not sell well enough on a single platform to crack the all-format top 20. (According to Michael Pachter of Wedbush Morgan, the game performed nearly twice as well as his 250,000 unit expectations for the month.)
Additionally, Tomb Raider: Underworld does not appear to have performed up to expectations. Moreover, neither Sony's Resistance 2 nor LittleBigPlanet cracked the top 20. Microsoft's Banjo-Kazooie: Nuts & Bolts also appears to have missed the mark.
According to the NPD Group, the top selling games (by units) were the following:

Several of the same titles which appeared on December's top 10 have also ranked as a top 10 selling games for the entire year.
Wii Play took the #1 spot and sold more copies in 2008 than it did in 2007. (Notably, its attach rate compared to Wii consoles is still higher than 50%, at least parly thanks to the packed-in Wiimote.) Follow Wii Play were Mario Kart for the Wii at #2, Wii Fit at #3, and Super Smash Bros. Brawl at #4.
The next nearest game, Grand Theft Auto IV for the Xbox 360, sold almost 900,000 copies fewer than Super Smash Bros. Brawl. Rounding out the top 10 were Call of Duty: World at War for the Xbox 360 (#6), Gears of War 2 (#7), the PlayStation 3 version of GTA4 (#8), Madden NFL 09 on the Xbox 360 (#9), and finally (and astoundingly) the relatively old Mario Kart for the Nintendo DS.
Even when these games are ranked by dollars generated, the top four titles (all for the Wii) will remain clustered as a group, with Wii Fit moving to the #1 spot, thanks to its premium pricing.
The industry has grown a tremendous amount in the past three years. It's true that the final total in 2008 did not reach the heights of $22-25 billion that many had thought possible.
But it must be stressed that the industry is still experiencing double digit growth, and has reason to be optimistic about the coming year.
This is even despite Gamasutra's additional analysis of 2008 numbers that shows only 10% year on year growth in the second half of 2008, the slowest since the first half of 2006.
To conclude, here's our in-depth graphical look at how the industry has grown from 2005 to 2008, with color-coded bars for each month.
It's easy to see the rapid growth of the industry via the following diagram:

At the end of 2008, the total installed base of current-generation consoles exceeded 38 million. That works out to roughly one console for each eight persons in the United States.
With that kind of penetration, the industry has a solid base on which to build future software sales - but not such a large penetration yet that growth might start becoming problematic.
To end, here's a Gamasutra-compiled graph showing the historical U.S. game industry revenues since 1997, plotted yearly:

As recently as 2004, the entire video game business in the United States was worth only $9.9 billion annually. Within four years, that figure has doubled.
While the industry may not break $25 billion in annual sales for 2009, given current economic conditions, it seems quite likely that it will do so by the end of 2010.
[As always, many thanks to the NPD Group for its monthly release of the videogame industry data. Additional credit is due to Mr. Michael Pachter, analyst for Wedbush Morgan Securities, for his industry analysis. Further thanks to colleagues at NeoGAF for helpful discussions, including Joshua J. Slone, donny2112, and several others.]
Read more about:
FeaturesYou May Also Like