


Trending
Opinion: How will Project 2025 impact game developers?
The Heritage Foundation's manifesto for the possible next administration could do great harm to many, including large portions of the game development community.
In a fascinating new article, Gamasutra presents graphs and analysis of ESRB ratings across all games for major consoles. Does the Wii's family-friendly reputation hold up in ratings? What rating of games proliferated towards the end of the Xbox's life? Answers within...

Recently GameStop, the videogame retailer, added a new feature to its online storefront that permits filtering of its game catalog by the ratings assigned by the Entertainment Software Rating Board (ESRB). Presumably, a savvy parent shopping for an 8-year-old child can now browse for games rated E (for "Everyone") and skip those rated E10+ which are appropriate for a slightly older audience.
I started looking at the number of games of each type per platform -- Nintendo DS, PlayStation Portable, Xbox 360 -- and it made me wonder what patterns I would see if I could visualize these distributions.
Fortunately, the ESRB has long provided a variety of means for searching its ratings database of rated games. After I compiled the data for several platforms, I began making charts of the distributions on individual consoles and handhelds. Those graphs revealed manufacturer-specific ratings distributions, and possibly even some evidence of how platforms have different strategies in different generations.
For our first comparison we'll examine three handheld platforms: the Nintendo Game Boy Advance, the Nintendo DS, and the Sony PlayStation Portable (PSP). As an exercise in analyzing these rating distribution graphs, the platforms are not indicated initially, and the graphs are given in random order. With a little bit of background knowledge and deduction each platform can be recognized just from its distribution.
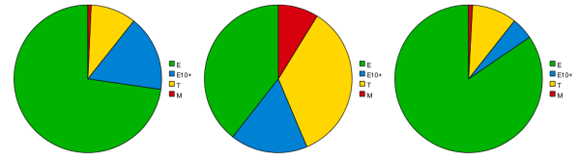
Can you tell which is which? The PSP will probably stand out to most people, but the real trick is knowing which is the Nintendo DS and which is the Game Boy Advance. The answers, and explanations, are shown on the next page.
Here are the two Nintendo handhelds, now with the platform identified on each graph:
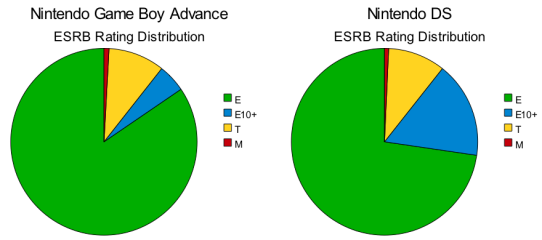
The relatively small number of games rated M (for "Mature") clearly identifies the two Nintendo platforms. The distinguishing feature between the two is the rating category E10+, which wasn't created until 2005, far into the life of the Game Boy Advance. Since the E10+ rating has existed for nearly the entire lifetime of the Nintendo DS, more of its games have received that rating.
If one considers the E and E10+ ratings as approximately the same, then the two Nintendo handhelds exhibit very similar ratings distributions. Fewer than 1% of the games for either platform were rated M and approximately 10% received a rating of T (for "Teen"). The rest were either E or E10+.
Now, here is the PlayStation Portable's distribution:
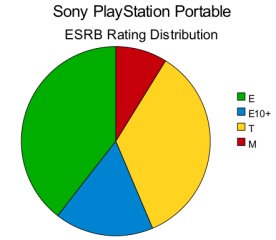
From the beginning Sony has aimed the PSP at an older demographic, and the ESRB ratings of its games reflect that strategy. Almost 9% of its games are rated M and nearly 35% are rated T.
I found some interesting comparisons in the last generation of consoles: the Sony PlayStation 2, the Nintendo GameCube, and the Microsoft Xbox. As before, take a minute to examine the graphs sans labels (again in random order) and try to reason which graph belongs to which platform from just the rating distributions.
The answers are given on the next page.
The easiest of the platforms to spot is the Nintendo GameCube. Here is its distribution:
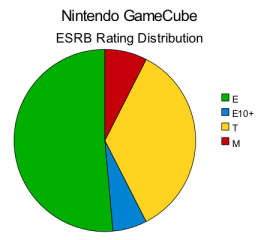
On both of the other platforms, the Xbox and PS2, games from the E and E10+ categories account for less than half of the game catalogs. On the GameCube over 51% of the games were rated E and 6.1% were rated E10+. This makes the GameCube appear to be more friendly for younger gamers. While only 7.5% of the GameCube catalog was rated M, that fraction represents a significantly larger proportion than found on either the Nintendo DS and Game Boy Advance where M-rated games are less than 1% of the software library.
The overwhelming success of the PlayStation 2 is the key to distinguishing its distribution of game ratings from that of the Xbox. As an exceedingly popular platform, the PlayStation 2 attracted budget-priced software and licensed games starring characters from children's television programs, cartoons, and movies. For this software to succeed commercially it must be accessible to the largest population possible. Therefore, publishers may seek the most consumer-friendly ratings of E or (at worst) E10+. For example, every SpongeBob SquarePants game in the ESRB database is rated E. Additionally, all but one of the 184 games with Disney in the title (across all platforms) received an E, E10+, or EC (for "Early Childhood") rating. (The exception -- a game based on the PG-rated Pixar movie The Incredibles -- received a T rating.)
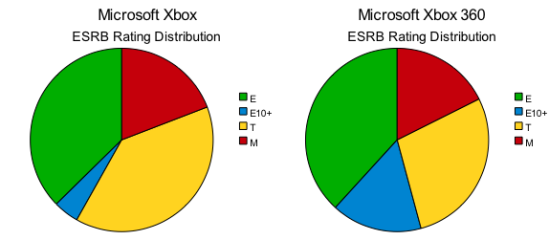
The flood of licensed and budget software on the PlayStation 2 may explain the modest differences between the distributions for the PlayStation 2 and Xbox, pictured below:
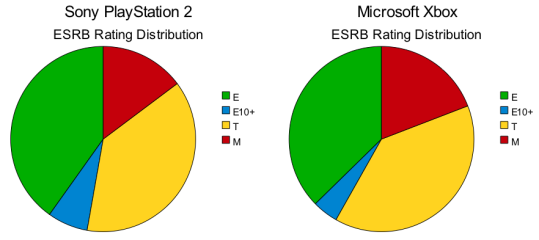
The PlayStation 2 has slightly more E-rated software (40.1% compared to 37.3% on the Xbox) and significantly more E10+-rated software (7.1% compared with 4.5%). Microsoft courted an older set of consumers with its Xbox marketing, which may explain why over 19% of Xbox games were rated appropriate for a mature audience. That is, publishers released M-rated games for a platform which appeared to attract older gamers.
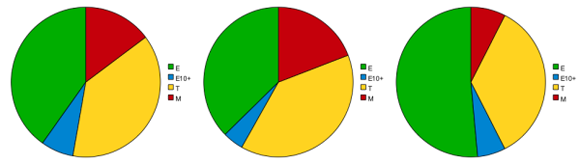
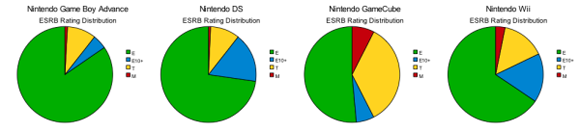
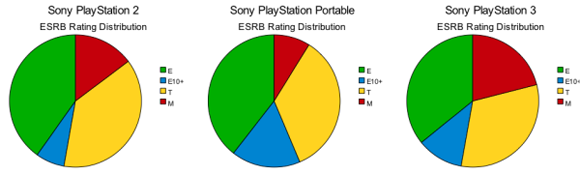
While we are only a year into the current generation of console hardware, the ratings of their games already reveal some interesting characteristics. As before, here are the graphs for each of the three systems, without labels and in random order:
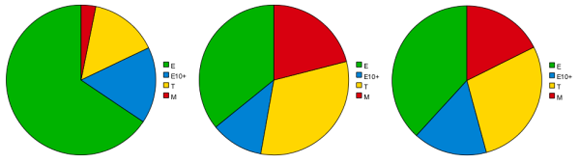
Take a few moments to try to determine which you think is which. Then go to the next page for the answers and some possible explanations.
As always, the Nintendo platform stands out for its selection of games appropriate for nearly all gamers.
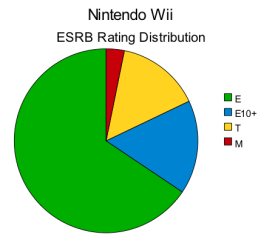
From the beginning Nintendo has wanted to attract non-traditional gamers with its Wii hardware and software. Perhaps as a result of the manufacturer's strategy, many Wii games have been designed to appeal to -- and therefore are rated for -- a general audience. Over 82% of the Wii catalog is either rated E or E10+. Only 3.2% are rated M, less than half the rate on Nintendo's previous console, GameCube. Still, that 3.2% is significantly higher than the rates on either the Nintendo DS or the Game Boy Advance.
Microsoft has announced its goal to court more casual gamers with games like Viva Piñata and Scene It! The distribution of ESRB ratings on the Xbox 360 is suggestive of just such a shift.
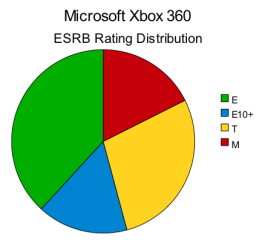
At this point in its life, over 54% of the Xbox 360 library is rated E or E10+. Compare this with less than 42% for those same categories of games on the original Xbox. It is also possible that some games which might have been rated T prior to 2005 are now being given the new E10+ rating. The class of M-rated games accounts for 17.6% of the Xbox 360 library, which is quite similar to the 19.2% of M-rated games on the original Xbox.
Finally, the PlayStation 3 has a distribution that is markedly similar to that of the PlayStation 2 and PlayStation Portable.
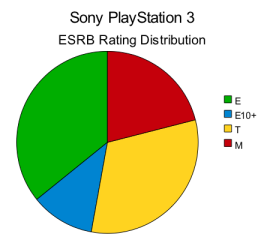
Almost exactly 47.2% of the individual libraries of the PlayStation 2 and the PlayStation 3 are rated E or E10+. Games rated T account for nearly 32% of the PlayStation 3 library compared to 38% on the PlayStation 2. The M rated games are a significant portion of the software on the PlayStation 3 currently: 21%, up from 14.8% on the PlayStation 2. No other platform, studied here has as high a ratio of M-rated games as the PlayStation 3. The two platforms with comparable numbers of M-rated games are the Xbox (19.2%) and Xbox 360 (17.6%).
With the exception of the GameCube, Nintendo platforms are all very similar in their distribution of ESRB ratings. That is, the GBA, Nintendo DS, and Wii all have about the same percentages of T-rated and M-rated games. It amusing to note that the one platform with a significantly different distribution of game ratings was also arguably the least successful.
The two Microsoft platforms are notable for their large proportion of M-rated games.
Sony platforms are also quite similar to each other. If it were possible to rerate the entire PlayStation 2 library to include E10+ games, its distribution might look much more similar to the PSP distribution.
The set of PlayStation 3 data consists of only 176 titles at this point, and therefore may change substantially in the near future.
The above comparisons show that each manufacturer generally has similar rating distributions across its hardware platforms.
We are only a year into the lifetimes of the Nintendo Wii and the Sony PlayStation 3. We can't know with certainty the final distribution of ESRB ratings on those platforms years in the future, but we can look back to last generation for some guidance. Specifically, did the ratings distributions for the GameCube, Xbox, and PlayStation 2 change from their first year of software to the final library of software?
For the period between October 2000 and December 2002, I have used the data available through MobyGames, which permits filtering of games by system, date, and ESRB rating. While MobyGames does not have an exhaustive record of all games for all three platforms measured here, its data for the period in question appears to be reasonably complete.
Below are the ratings for the games released on the PlayStation 2 between its launch and the end of 2001, approximately 14 months. Beside it, we've placed the graph of the distribution for all PlayStation 2 games to date, over seven years since the system launched.
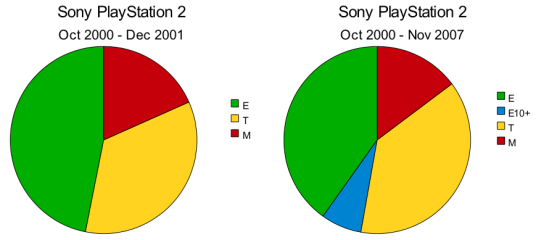
If we combine the E and E10+ categories, the two graphs are very similar. That is, the distribution of ratings did not appear to change much in the time from October 2000 to November 2007.
The Nintendo GameCube during its first 13 months -- from November 2001 to December 2002 -- is also a reasonably good predictor of that platform's final distribution of ESRB ratings:
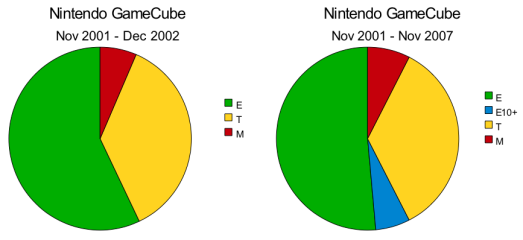
Again, combining the E and E10+ categories makes the two graphs look almost identical.
The Microsoft Xbox, shown below, is an exceptional case:
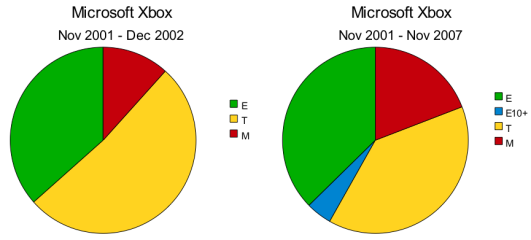
Notice that the prevalence of M-rated Xbox games grew significantly over the lifetime of the system. In fact, the prevalence of M-rated games on the Xbox grew from 11.7% of the library at the end of 2002 to 19.2% today. During that same period, the representation of T-rated games in the Xbox library diminished and the importance of E-rated games increased.
The increase in the importance of E-rated games at the end of the Xbox's market lifetime could be an indication that Microsoft's plan to reach out to a wider audience of gamers is not a recent development driven only by the rise of the Wii.
A game submitted to the ESRB for review is typically assigned a rating irrespective of whether that game reaches the market or not. For example, Payback by Destination Software for the Game Boy Advance was given an M rating but was never released in North America. (It was released in other regions, like the United Kingdom and Europe, where it was declared appropriate for gamers aged 12 years and older.)
Moreover, the ESRB database contains games which have received ratings and will be released in the near future. As of this writing (11 November 2007), the game Time Crisis 4 for the PlayStation 3 has been assigned a rating of T by the ESRB, the ESRB database reports this rating, and the game will be released in a matter of days. On the other side, the database does not report a rating for Uncharted: Drake's Fortune, another PlayStation 3 game which is on its way to stores now. [Ed. note: Both games have been released as of this writing. Uncharted eventually scored a Teen rating.]
For these reasons the ESRB database is not a perfect reflection of reality. However, the defects in the data are small relative to the total number of games. The ESRB database reports well over 1000 games for both the PlayStation 2 and the Game Boy Advance, which means each game represents less than one tenth of one percentage point.
On the other end, the PlayStation 3 has 176 games in the database, so a single game represents around six tenths of a percentage point. Nearly every feature of the distribution graphs discussed above represents three percentage points or more. Therefore what errors exist in the ESRB database will not greatly affect the contours of the graphs above.
Read more about:
FeaturesYou May Also Like