

Daily news, dev blogs, and stories from Game Developer straight to your inbox
Sponsored By
Analysis: Are Digital/Used Sales Making Up For The New Retail Drop?
As part of his <a href=http://www.gamasutra.com/view/feature/6513/npd_behind_the_numbers_september_.php>monthly NPD Group physical game sales analysis</a>, Gamasutra analyst Matt Matthews explores NPD's claim that digital and used sales are making up for
10 Min Read

[As part of his monthly NPD Group physical game sales analysis, Gamasutra analyst Matt Matthews crunches the numbers behind NPD's claim that digital and used sales are making up for the decline in retail sales across the industry.] As the American retail video game industry has struggled through several spare and troubling months in 2011, more attention has been paid to the other segments of the market which are more independent of the traditional retail channel. Among these are full digital game downloads, social network games, downloadable content, and games for non-traditional mobile platforms like smartphones and tablets. The basic question: When all monetization methods are considered, is the video game market growing, contracting, or maintaining its previous size? Just looking at retail, content sales for consoles and traditional handhelds (like the Nintendo DS) have shrunk significantly. Through September 2011, those segments of the market have contracted over 5% from the same point in 2010 and almost 24% from the same point in 2008. In absolute terms, year-to-date retail content sales are down approximately $1.6 billion from the peak three years ago. According to a recent video posted by the NPD Group to its YouTube channel, the decline in retail has coincided with the proliferation of alternative means for consumers to find gaming content. In the video Anita Frazier, an analyst for the NPD Group, goes on to say that the company has “seen through [its] expanded coverage of the market that the sales to consumers of content through these other ways of acquiring content is actually making up for the decline in retail sales.” While it isn't an absolute statement – Frazier doesn't say specifically that the other segments are completely making up for losses at retail – hers is as informed an opinion as one is likely to see on the growth of the market. If the industry appears to be contracting, then at the very least new sources of revenue are stepping into the breach. The NPD Group produces a quarterly report entitled Games Industry: Total Consumer Spend which outlines the company's estimates for the entire video game content market. In addition to the segments already mentioned, the company also estimates sales of used video games, for example by GameStop, and video game rentals. In its latest public release about consumer content purchases during the second quarter of 2011, the company stated that $1.44 billion was spent on traditional new content (console, handheld, and PC games at retail) while $1.74 billion was spent on all other channels combined. That follows an earlier report that $2.03 billion was spent at retail on traditional content during the first quarter of 2011 while $1.85 billion was spent on content through other means. While the NPD Group is well-positioned to measure these markets as well as any other company, a longer view of these figures – and figures from earlier Total Consumer Spend reports – shows that the metrics are still not perfect. Two quick examples should make that point:
In October 2010 the NPD Group announced that total content sales in the U.S. for the first half of 2010, across all channels, were estimated at $2.6 – 2.9 billion. But based on the year-over-year growth rates given for the 1Q and 2Q figures for 2011, it now appears that the 1H 2010 figure was closer to $3.3 billion, an increase of nearly $400 million.
Judging from comments made by Anita Frazier in a note to the press in April of this year, all other forms of video game content sales in 2010 except for traditional new retail content accounted for $5.8 billion. Given the previous bullet point, we can estimate that all those other forms of content sales broke up into $3.3 billion in the first half of 2010 and $2.5 billion in the latter half of 2010, a decline of 24%.
See the graph below for a visualization of just the decline in the Other category that we're highlighting. 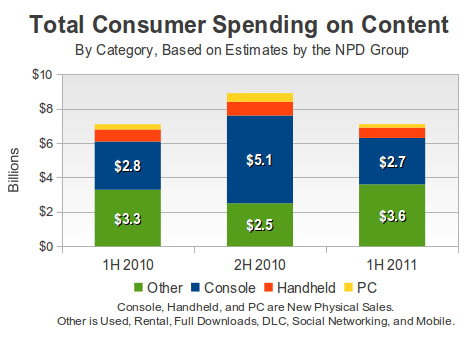 There is at least one reason to be skeptical of that decline in the second half of 2010: used video game sales at GameStop. According to that company's filings with the Securities and Exchange Commission, used product sales (which includes used hardware and accessories) see an increase of approximately 50% during the last quarter of each year. We estimate that GameStop's used video game content sales account for around a quarter of the revenue that the NPD Group is measuring outside of traditional new content sales. If used game sales spike during the last quarter of each year but total revenue outside of traditional retail declines, then all those other content sales – social network games, mobile platform games, and so on – would have to take quite a hit. That may very well be what the NPD Group's measurements are saying, but at the very least one should be surprised at the conclusion. After the latest NPD Group results for retail sales last week, we asked Wedbush analyst Michael Pachter his outlook on the Total Consumer Spend report, and he wrote back that it is “too early” for him to have a fully-formed opinion about the figures. He says he won't subscribe to the service “till I see if it is relevant.” Early last week we voiced our skepticism to the NPD Group directly, laying out the ways in which these estimates lacked consistency over time and didn't jibe well with what we believed were solidly established trends in used game sales. We had a productive discussion about the report and its methodology. As a result of those conversations, the President of the Games Division at the NPD Group, David McQuillan, was kind enough to field some questions we had about the Total Consumer Spend report.
With content reaching consumers through so many different channels, the job of measuring what consumers are really spending seems quite challenging. Can you tell us a bit about how the data is collected for the Total Consumer Spend research?
David McQuillan: Our methodology for developing the Games Industry: Total Consumer Spend estimate leverages many sources, including but not limited to, point-of-sale (POS) data, multiple syndicated NPD consumer trackers covering games and gaming-capable devices, data sourcing from multiple calibration partners, and more.
While it’s a different methodology than what people are used to seeing from POS sales data, it is based on a large number of consumer reported transactions and calibrated using sound market research methodology.
I think it’s just so different from what people are used to in the games industry that it takes some getting used to, but our clients are getting more and more comfortable with how it can be used to help them with their business decisions. As a point of reference, there are many industries, such as the toy industry, which is solely tracked through consumer reported purchases and does not have a POS component to it. It’s not unusual at all.
How often are you producing estimates for customers, and how does that compare to the frequency of data collection for the report? Can you elaborate on that process?
DM: We currently report the information on a quarterly basis. The frequency of data collection varies from weekly or quarterly depending on the primary consumer data source. We synthesize the various sources as they become available and issue our estimate at that time. Our first priority is reducing the turnaround time of our quarterly estimates and our next priority is to increase the frequency of reporting the bigger picture.
We haven't noticed any industry stakeholders – publishers, hardware companies, and retailers – commenting on the Total Consumer Spend estimates. What response are you seeing from them?
DM: We have many clients purchasing the service including retailers, publishers and the financial community. As an indicator of client interest in the information - expanding our tracking of the games industry beyond the physical format - we have been encouraged by many of our current clients to expand this market sizing estimations into Europe and Asia.
[Ed. note: According to the latest press release, coverage of the UK, France, and Germany will begin in early 2012.]
Of course, our clients would like to have the data at a more granular, more frequent level – a goal that we share. This is a first step on what we expect will be a dynamic journey that will require a flexible methodology, which we have developed. The industry and business models are changing too rapidly to not remain nimble.
In our earlier conversations, we noted what appear to be some discrepancies and revision of earlier consumer spending figures for content. What are the factors driving the refinement of those figures?
DM: We are continually expanding our market coverage. One recent example is the expansion of our mobile coverage to expand beyond smart phones to also include deck phones. We are also making refinements to our methodology either in terms of the approach or as the sources of data are improved upon or expanded.
Our goal is to provide the best estimates of the market based on what we know today and the information available to us. We are very candid with our clients that these estimates don’t provide the same level of precision at POS data, but it still provides the best market estimate using widely accepted market research best practices.
In August the NPD Group announced that it had worked with many video game industry players to develop a coherent taxonomy for classifying video game content monetization methods. For example, the sale of content can now be classified by the delivery channel (e.g. brick & mortar store or online retail) or segment (e.g. console or mobile phone), as well as several other categories. How does that figure into how the Total Consumer Spend estimates are produced and reported?
DM: The Games Industry Taxonomy provides the industry with a framework for discussing the rapidly changing market. We will use this taxonomy, which we will revisit and modify as needed due to market changes, to help inform additional areas of spend that need to be captured through whatever data source is best suited to it.
In the details of the report we do refer to the taxonomy to help facilitate the adoption of a common language with which to reference the state of the industry.
Back to those restatements of revenue – will there continue to be restatements of earlier public revenue estimates from the Total Consumer Spend report?
DM: It’s likely.
For example, right now we don’t report on revenues generated by “gaming in the cloud”. As we collect more information we will add that to our estimate as well, and using trend data we may adjust previously reported periods.
We only will do that if there is a client benefit to doing so. Our first priority is to make sure our clients have the best information currently available to inform their business decisions, and we also make a portion of that available to the public, like media outlets, to the extent it helps inform their reporting.
We note that, without those public releases, practically every conversation about video game sales trends would be reduced to hand-waving and back-of-the-envelope estimates based on SEC filings and the stray publisher press release. It's clear that the NPD Group is working hard to produce solid estimates of video game content sales, and it's also clear that there are still some areas in which it can improve its measurements of sales outside of traditional retail. The industry has hit a rough patch, especially as consumers have cut back on spending on games delivered on discs and cartridges. The NPD Group believes that that lost revenue is getting replaced through other channels – and for now we have little choice but to believe it.
Read more about:
2011About the Author(s)
You May Also Like


.jpeg?width=700&auto=webp&quality=80&disable=upscale)


