Daily news, dev blogs, and stories from Game Developer straight to your inbox
Sponsored By
Using ADB Logcat to Debug Unity Application Start Up Times
How to debug Unity build start up time on the Android platform with adb.
6 Min Read

Our game The Dog Run has been in open Beta testing for some time and we are wrapping up new builds after the feedback we received during the process.
There is still time if you want to check out the Beta edition of the game on the Play Store: https://play.google.com/apps/testing/com.ZuluOneZero.TheDogRun
We used the built in Unity Profiler to work on performance improvements on the running game.
https://docs.unity3d.com/Manual/Profiler.html
But when it came to the application start up we found that we had a problem. It was taking over 20 seconds for the game to open up after a user pressed the icon.
Obviously this was way too long as much of that time was spent sitting on a black screen.
Trouble was with the Debug builds of our APK's running in the profiler it would only pick up on game play issues and we couldn't identify what was causing the slowness on start up. So we switched to using ADB the Android Studio Debugging Bridge to see what was actually going on under the hood of Android system while our game was loading.
If you want more info on the ADB tool have a look at my previous post here.
http://www.zuluonezero.net/2018/09/21/unity-debugging-with-adb-for-android/
We had a handfull of APK's that we wanted to test against on out local workstation and used APK to copy them over to our attached development device using ADB commands.
Like this:
C:\Users\<User>>adb install C:\Users\<User>\Downloads\TheDogRun_v13_debug.apk
Success
Then we ran the adb command with the logcat argument and passed that output into a file to read afterwards.
Now pumping logcat into a file generates lots of data including the buffer that was recorded before the command was run so you will get lots of info from earlier that you either need to filter out or grep through.

This is one way to filter out in adb command line but it's not as useful as grepping through the file:
>adb.exe -d logcat -e isApplicationExternalStorageWhitelisted
It's a pretty big log generated in just a few seconds of logging:

I preferred to have the full log in the file and use notepads and command line greps and epreps to get the info I wanted to hone in on.
On Windows I have a great Unix like tool called MobaXTerm which is really useful for this sort of work.
https://mobaxterm.mobatek.net/
It's a Windows ssh client but includes a Cygwin type access to your local Windows file systems.
So when we were searching through the logs (and it takes a while to get used what you are looking at. I'd recommend getting on google for anything that looks interesting).
Here is an example of the log:

It changed a little bit with each run but this is the main info that I was using for to make my judgements about start up speed on.
### This is the initial call for the application
09-28 10:29:08.684 4938 4938 D StorageManagerService: getExternalStorageMountMode : final mountMode=1, uid : 10495, packageName : com.ZuluOneZero.TheDogRun
### This is the process being allocated
09-28 10:29:08.752 4938 4938 I ActivityManager: Start proc 8679:com.ZuluOneZero.TheDogRun/u0a495 for activity com.ZuluOneZero.TheDogRun/com.unity3d.player.UnityPlayerActivity
### The Window for the game is open had has focus
09-28 10:29:09.336 8679 8679 I Unity : windowFocusChanged: true
09-28 10:29:09.337 8679 8679 V InputMethodManager: Starting input: tba=android.view.inputmethod.EditorInfo@23ee73 nm : com.ZuluOneZero.TheDogRun ic=null
09-28 10:29:09.346 4938 6402 V InputMethodManagerService: windowGainedFocus : reason=WINDOW_FOCUS_GAIN client=android.os.BinderProxy@9752c36 inputContext=null missingMethods= attribute=android.view.inputmethod.EditorInfo@ea1162f nm = com.ZuluOneZero.TheDogRun controlFlags=#105 softInputMode=#20 windowFlags=#80e90500
### The Game has the Window on
09-28 10:29:09.420 4938 5124 D SamsungPhoneWindowManager: Turning screen on : com.ZuluOneZero.TheDogRun uid = 10495
### Splash Screen is coming up
09-28 10:29:09.424 4938 5124 D InputEventReceiver: channel 'd7f15c8 Splash Screen com.ZuluOneZero.TheDogRun (client)' ~ Disposing input event receiver.
### Splash Screen removed
09-28 10:29:09.431 3192 3192 I Layer : id=6192 onRemoved Splash Screen com.ZuluOneZero.TheDogRun#0
### This is a Debug Package but the Unity Debugger or Profiler was not attached so there is a 4-5 seconds delay while it times out waiting for the connection
48832 [Id] AndroidPlayer([email protected]) [Debug] 0 [PackageName] AndroidPlayer" to [225.0.0.222:54997]...
09-28 10:29:09.544 8679 8696 D Unity : Waiting for connection from host on [0.0.0.0:55070]...
09-28 10:29:14.571 8679 8696 D Unity : Timed out. Continuing without host connection.
### Scripting Engine starts up
09-28 10:29:14.682 8679 8696 D Unity : InitializeScriptEngine OK (0xe7543ee0)
09-28 10:29:14.682 8679 8696 D Unity : PlayerConnection already initialized - listening to [0.0.0.0:55070]
## Creating Open GL
09-28 10:29:14.761 8679 8696 D Unity : OPENGL LOG: Creating OpenGL ES 3.2 graphics device ; Context level <OpenGL ES 3.1 AEP> ; Context handle -1013109888
### Unity Reports it's Unload time
09-28 10:29:22.067 8679 8696 D Unity : UnloadTime: 2.403000 ms
### Ads Start up
09-28 10:29:22.309 8679 8696 D UnityAds: com.unity3d.ads.cache.CacheDirectory.getCacheDirectory() (line:42) :: Unity Ads is using external cache directory: /storage/emulated/0/Android/data/com.ZuluOneZero.TheDogRun/cache/UnityAdsCache
### About this time the Debugging on the Application side kicks in and you start to get these sorts of messages in the log:
09-28 10:29:23.533 4938 9976 I ActivityManager: DSS on for com.ZuluOneZero.TheDogRun and scale is 1.0
09-28 10:29:23.731 8679 8696 I Unity : Building GPG services, implicitly attempts silent auth
09-28 10:29:23.731 8679 8696 I Unity : #0 0xc6578460 (libunity.so) GetStacktrace(int) 0x44
09-28 10:29:23.731 8679 8696 I Unity : #1 0xc5f5e978 (libunity.so) DebugStringToFile(DebugStringToFileData const&) 0x230
09-28 10:29:23.731 8679 8696 I Unity : #2 0xc546bf9c (libunity.so) DebugLogHandler::Internal_Log(LogType, core::basic_string<char, core::StringStorageDefault<char> >, Object*) 0xa8
09-28 10:29:23.731 8679 8696 I Unity : #3 0xc546be8c (libunity.so) DebugLogHandler_CUSTOM_Internal_Log(LogType, MonoString*, MonoObject*) 0xb4
09-28 10:29:23.731 8679 8696 I Unity :
09-28 10:29:23.731 8679 8696 I Unity : (Filename: ./Runtime/Export/Debug.bindings.h Line: 43)
09-28 10:29:24.925 8679 8850 I UnityAds: com.unity3d.ads.api.Sdk.logInfo() (line:70) :: Requesting configuration from https://publisher-config.unityads.unity3d.com/
Total start up time around 16 Seconds - we got lucky with this one.
But you know it's system dependent so we did it another ten times for each package to make sure that the readings were comparable to our out loud counting of seconds while watching the device.
To make a long story short we started getting an idea of what happens when the app starts up.
In the end the thing that most improved our startup time was the build that had changed settings to our audio files in the Unity import settings.
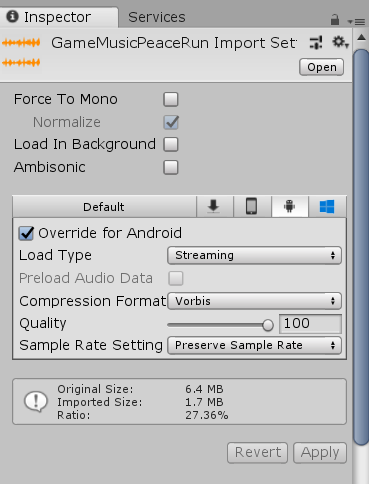
Basically all audio files were converted from the Unity default to the Overide for Android setting. The background music was streamed and shorter sound effects were compressed in memory.
So hopefully if you take this advice do that up front and you won't have to spend a fun rainy Sunday debugging the start up time problem.
Interesting as it was it would have been more fun doing promo art for the upcoming release!
Read more about:
BlogsAbout the Author(s)
You May Also Like
Latest News

Trending


Featured Blogs