Daily news, dev blogs, and stories from Game Developer straight to your inbox
Sponsored By
Featured Blog | This community-written post highlights the best of what the game industry has to offer. Read more like it on the Game Developer Blogs.
Reproducible Research: StarCraft Data Mining
Revisiting a research paper from 2009, here's how I'd approach the problem today.
6 Min Read

In 2009 I published a paper on predicting build orders in StarCraft: Brood War using different classification algorithms. I made the data set available for other researchers to test out, and some academic projects have made use of this data set. However, I never made the source code available for the experiments and eventually lost it, similar to Blizzard and the source code for the original StarCraft. Since transitioning to the games industry, I’ve started advocating for my coworkers to build reproducible research. This means authoring code that outputs results and that removes manual steps, and using environments that can be reproduced on different machines and platforms.
There’s been renewed interest in StarCraft AI research since the announcement of StarCraft Remastered and Google’s DeepMind being applied to StarCraft II. Now that nearly a decade has passed since I first published this research, I was curious if I could reproduce the experiment, and see if more recent techniques such as XGBoost would outperform the previous classification algorithms I tested.
Original Setup
My original setup for these experiments was a mix of Java code and the Wekalibrary. I first tested out different classifiers using the interactive Weka GUI, and then switched to using the Weka API once I wanted to run experiments. My Java scripts would run experiments and output the results to text files, which I manually copied into excel when producing charts. I ran experiments on both my Windows laptop and the university’s Unix servers.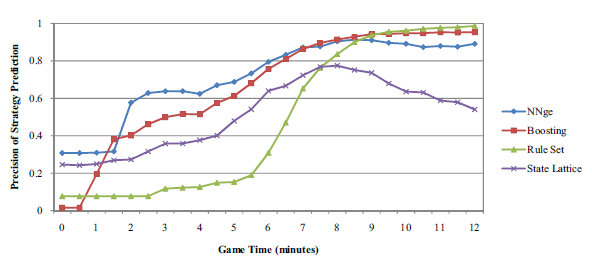
The key experiment I wanted to reproduce was predicting opponent build orders at different simulated times during the game. The output of this experiment from my paper is shown above. As more information is made available to the different algorithms, they become better at identifying the opponent’s build order. The 1000+ replays were labeled with 6 different build orders, and my approach for labeling the build orders in covered in more detail in the paper.
New Script
My new approach for running this experiment in a reproducible way is to use R Markdown, which is a markdown language that can embed R code and visualizations. The goal of this approach is to remove all manual steps when running experiments. The markdown script downloads the necessary data files from github, runs the experiments, and renders the results to a pdf document or html file. The script is available here, and the results are available in pdf and html formats. One of the outputs of this script is the figure shown below.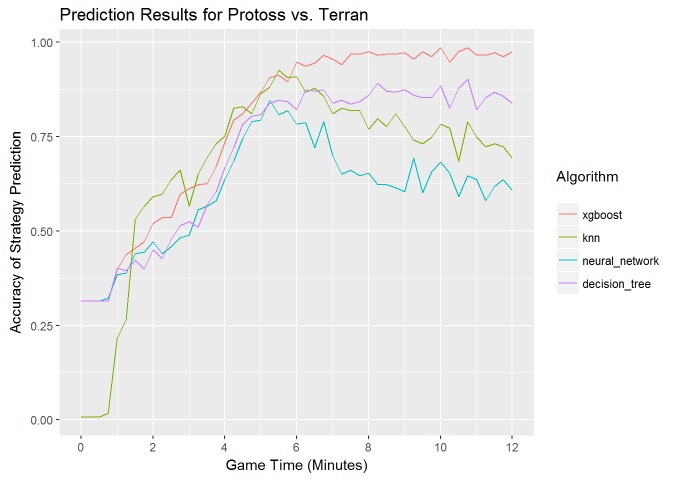
The script loads the data frame for Protoss vs Terran build orders directly from Github. This eliminates the need to copy files locally for the experiment.
df <- read.csv("https://github.com/bgweber/StarCraftMining/
                         raw/master/data/scmPvT_Protoss_Mid.csv")
The experiment starts at 12 minutes game time, and then steps backwards to simulate different time steps during the games. I used this approach to avoid having to reload the data frame multiple times. The segment below shows how the data frame (df) is filtered to a specific game time (frame).
for (i in colnames(df)) {
  if (i != 'label') {
    index <- df[i] > frame
    df[i][index] <- 0
  }
}
I applied classifiers from the following packages: nearest neighbor (class), decision tree (rpart), neural networks (nnet), and xgboost(xgboost).
predict <- knn(train, test, train$label, use.all = FALSE)
reg <- nnet::multinom(label ~ ., data=train, trace = FALSE)
model<- rpart(factor(label) ~ ., data = train)
bst <- xgboost(data = trainM, label = train$label, ... )
And plot the results using ggplot2, which produces the figure above:
ggplot(data=melt(results, id="minutes"), aes(x=minutes, y=value,
                         colour=variable)) + geom_line() + ...
The results show that xgboost does outperform the best performing algorithm from the paper, LogitBoost, at 10 minutes game time with an accuracy of 96% vs 94%. However, the original finding of nearest neighbor approaches outperforming the other classifiers during the early game still stands.
The script also generates a second chart, which is the importance of different features at 8 minutes into the game. This is a type of analysis that I did not include in the original paper, but is interesting to include here because it shows what players should look out for when scouting an opponent. The importance of features changes over time, based on the trained model. The visualization below was generated using the xgboost functions xgb.importanceand xgb.plot.importance.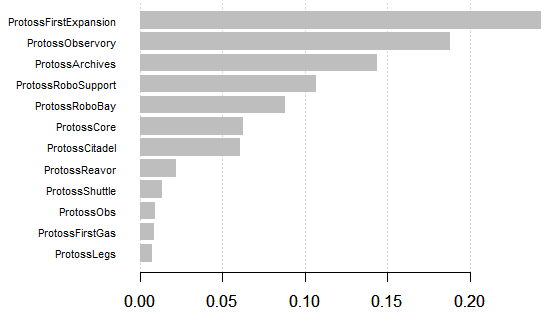
New Environment
I wrote the R Markdown script on my Windows laptop for testing. To make the experiment reproducible across different machines and environments I used Docker. I started with the CentOS image, installed R, setup the libraries and other dependencies such as pandoc, and then ran the script which outputs an html file with the visualizations. I spun up a EC2 instance on AWS, using the Amazon Linux instance, and ran the following commands. Some of the commands are highlighted in the segment below:
# install and start docker
sudo yum -y install docker
sudo service docker start

# get the centos image, and start it in interactive mode
sudo docker pull centos
sudo docker run -t -i centos /bin/bash

# install R, which requires updating the repo
yum -y install R
# install required R packages
R -e "install.packages('caTools', repos='http://cran.us.r-project.org')"
...

# download the RMD file
wget https://github.com/bgweber/StarCraftMining/SC_Data_Mining.Rmd

# run the script!
Rscript -e "rmarkdown::render('SC_Data_Mining.Rmd')"
For this example, I ran the container in interactive mode. If I wanted to persist the environment for running the experiments in the future, I would create and apply a docker file and save the resulting image to a docker registry. This would ensure that changes to the R libraries or other dependencies do not impact the experiment environment.
Conclusion
If I were to rewrite this research paper today, I’d recommend using tools that make the experiments repeatable. Using R Markdown and Docker is one approach that can help accomplish this goal.
Reposted from my Medium Blog. The Science Team at Twitch is growing!
Read more about:
Featured BlogsAbout the Author(s)
You May Also Like
Latest News

Trending

Featured Blogs