Daily news, dev blogs, and stories from Game Developer straight to your inbox
Sponsored By
Gamasutra analyst Matt Matthews' <a href="http://www.gamasutra.com/view/feature/5887/npd_behind_the_numbers_may_2010.php">look at May's NPD results</a> examines platform-specific software sales -- with exclusive new tie-ratio data -- finding a "dramatic"
6 Min Read

[Gamasutra analyst Matt Matthews' look at May's NPD results examines platform-specific software sales -- with exclusive new tie-ratio data -- finding a "dramatic" slowdown in the Wii software market, growing PS3 marketshare and more.] Were it not for the decline in hardware revenues, the perception that the industry is struggling might not be so intense. After all, software revenue grew year-over-year in May 2010 and is down year-to-date by only 6.7%. However, there is still a lot of movement under the surface, and it is worth breaking the figures out in a bit more detail. First, it does appear that software unit sales have eroded further in the first five months of 2010 than they did in the first five months of 2009, according to comments made by Wedbush's Pachter. As the figure below shows, while average weekly software unit sales declined by only 3.2% in the January – May period of 2009 (compared to the previous year), average weekly software unit sales declined a further 9.5% for that period of 2010. (Caveat: The figure below has a vertical axis range of 1.0 to 5.0, to highlight the difference in the rates.) How big is that differential in absolute terms? Here's one way to view it: if each game in the top 10 during May 2010 had sold three times as well, the industry in 2010 would still not have caught up to level of software unit sales it had achieved year-to-date in May 2009. 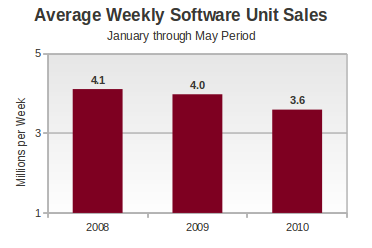 Total software revenue has declined only 6.7% this year, noticeably better than the nearly 10% fall in unit sales. The difference, of course, is that consumers are buying slightly more expensive games, leading to an increase in the average selling price (ASP) and lessening the blow that dropping unit sales has had on total revenue. According to comments made by Wedbush's Pachter, the current situation appears to be a rather interesting reversal of fortunes for Nintendo's Wii and PlayStation 3. In all but two of the last nine months, Wii software revenue has dropped year-over-year by double-digit rates; in the other two months the Wii saw a 10% increase (December 2009) and a more modest 7% decrease (March 2010). Meanwhile the PlayStation 3 has demonstrated double-digit software revenue increases in all but one of the last nine months; in that other month (December 2009) its year-over-year increase was only 8%. During that same period the Xbox 360 has seen some amazing months (like November 2009, with the launch of Call of Duty: Modern Warfare 2) and some dismal ones (like January 2010, when its year-over-year software revenue was down by over 60%). A picture tells the story far more eloquently. Here is our estimated current-generation console software revenue for the first five months of 2009.
 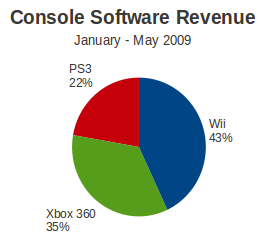 Now compare this to the same measure, but for 2010.
 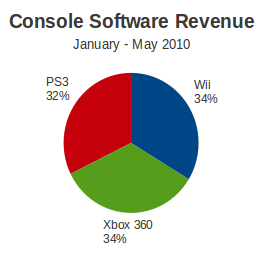 The change is striking: Sony's PlayStation 3 has taken up every bit of marketshare ceded by Nintendo's Wii. Perhaps as important is this fact: the PS3 generated as much software revenue as the Wii in the first five months of 2010, but did so with only 40% of the installed hardware base of Nintendo's console. If Wii sales have fallen, and handheld software sales have contracted, this does much to explain the increase in the rising prices of software sold at retail. Outside of handheld software, which has been traditionally priced lower than console software, the PlayStation 2 and Wii are the two consoles with the lowest software ASPs. With the PS2 now accounting for less than 5% of the software market (by revenue) and the aforementioned drop in Wii software sales, the Xbox 360 and PlayStation 3 contributed more to software's average selling price. According to Pachter, software reached an average price of $41.17 in May 2010, its highest value so far this year. While the Wii may be slowing down, the platform has still moved a tremendous amount of software in its time on the market. To get a handle on just how much Wii software has been sold at retail so far in the United States, we looked at the tie ratio figures for each of the current-generation consoles, provided exclusively to Gamasutra.
 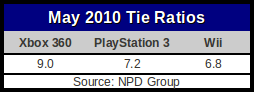 As the Xbox 360 has been on the market for a year longer than the other two platforms, it makes sense to compare to its tie ratio in May 2009, which we estimate was around 8.4. Anita Frazier, analyst for the NPD Group, cautioned that these figures “do not make an allowance for the Wii Sports pack-in with the hardware”. It also will not include the copies of Wii Sports Resort bundled with newer Wii hardware. Utilizing these figures and the sizes of each platform's installed hardware base, we can estimate each system's total software sales. To produce the table below, we've drawn on tie ratio figures released by the NPD Group and hardware manufacturers over the past several years.
 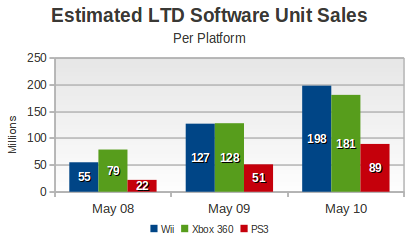 Around May 2009, about the same number of units of Wii software had been sold as Xbox 360 units, despite the latter platform having had an additional year on the market. Now in May 2010 the Wii appears to have a lead of around 17 million units. During the same period, the PlayStation 3 has fallen further behind both platforms. Even if the PlayStation 3 software situation has changed, and the Wii has also slowed down, Sony's platform has a long way to go before it looks more comparable to its peers in the total software sold. Finally, we examined a metric we first encountered in the posts of NeoGAF poster JoshuaJSlone: average weeks per game purchase. The basic idea is to estimate how often owners of a particular platform purchase a new game, estimated by dividing a platform's total software sales by the number of weeks of ownership for each platform (computed as the convolution of the installed base p(t) with the linear function t). Before giving the results of these calculations, be aware that these figures will almost always increase as a system ages. So for a new system with an energized base of owners, the average time between new software purchases may be very short. Obviously, in the long run, when a system nears the end of its life, the average time between purchases will grow longer. From our calculations, each Xbox 360 owner had been a buying a new game on average every 8.1 weeks in May 2008. By May 2010, that had increased to 12.2 weeks (for the entire population of Xbox 360 owners, measured from the time of the system's launch). The same metric applied to the Wii showed that its base of owners had been buying a new game every 6.7 weeks on average in May 2008, but that the time between purchases had grown to 12.3 weeks as of May 2010. The same figures for the PS3 are 7.6 in May 2008 and 11.1 in May 2010. Along with all the other metrics we've examined above, the figures above lead one to the same conclusion: Wii software sales are slowing down, and they're slowing down more quickly than they are on other platforms. The bottom line on 2010 software: By several measures – year-over-year growth, tie ratios, and weeks per game purchase – the Wii software market appears to be slowing dramatically. This has contributed to the decline in revenue in the software segment, even as the PlayStation 3 has increased its marketshare and offset some of the losses due to the Wii. The Xbox 360 continues to reliably generate software revenue.
About the Author(s)
You May Also Like