Daily news, dev blogs, and stories from Game Developer straight to your inbox
Sponsored By
Which Metrics Should You Measure According To The Pirate Analytics (Mobile/F2P Games)
In this blog post I'll be discussing the metrics which you should be measuring according to the pirate analytics (AARRR). The content within this post is focused on metrics used in Mobile/F2P games.
13 Min Read

In this blog post I'll be discussing the metrics which you should be measuring according to the pirate metrics (AARRR). The content within this post is focused on metrics used in Mobile/F2P games.
Foreword
This information is based on my own experience and multiple books & articles I've read over the past year. I've tried to give as much credit to the original authors as possible, if I've missed something please let me know in the comment section, thank you.
The post starts with a quick explanation about the AARRR metrics and the true meaning of KPIs. Next, I'll be discussing the most important metrics derived from the AARRR analytics.
NOTE: The metrics mentioned below are, in my opinion, the most important ones to measure. If I missed anything, or if you have a different view about this subject, I would be glad to discuss this with you :)
1.1. AARRR
The basic concept of analytics is based on 5 types of measurements of user behavior (known as AARRR):
Acquisition – where / what channels do users come from?
Activation - do users have a great first experience?
Retention - do they come back & revisit over time?
Referral - do they like it enough to tell their friends?
Revenue - can you monetize any of this behavior?
1.2. KPIs
KPIs are your Key Performance Indicators. They're the metrics that you will use to define whether your game is meeting your objectives. You need to be able to define your own KPIs and events in order to ensure you are properly measuring your game on your own parameters. As each game is different, your KPIs can vary on a game-to-game basis.
KPIs are metrics that:
Help you to evaluate the success of your game or your company.
Give you a broad understanding of your business’s current position.
Show your progress towards key goals.
1.3. Acquisition
1.3.1. Cost Per Install (CPI), Cost Per Loyal User (CPLU)
The Cost Per Install measures your customer acquisition costs for customers that installed your app in response to seeing an advertisement (tracking paid installs rather than organic installs). And the derived Cost Per Loyal User metric looks at the cost of acquiring an active user (defined as anyone who launches your app at least three times).
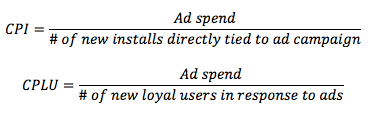
CPI (and the derived CPLU) is best used in combination with ARPU to calculate the return on investment for your marketing efforts. In order for marketing to make sense, your ARPU must be greater than your CPLU.
1.3.2. Daily Active Users (DAU)
You know how many app downloads you’ve had, but just how indispensable is your app for those who’ve installed it? The daily active users metric will tell you just that. Because this refers to each individual person using your app, not to the number of sessions, each person is counted just one time, regardless of if they use the app once per day or hundreds of times per day.

1.4. Activation
1.4.1. Track Every Step Of The Tutorial
Regardless of which tutorial style you choose, it’s important to track every step in the tutorial. The tutorial is the most important part of a F2P game because it engages users and teaches them about their new virtual world. Track every single step in the tutorial to measure the points where users drop off.
Dissect the points in the tutorial that have the largest drop-offs of users and figure out why people are leaving. Is there a large point of friction that can be avoided? Is the mechanic difficult to learn? Maybe the example level is confusing and the user’s goals need to be clarified. Whatever the cause may be, addressing these drop-offs in a tutorial funnel will help more users stick around.
1.4.2. Screen Flow
Screen flow tracks exits by screen, flow between screens, and total occurrences of visits to screens, visualizing the typical visitor interactions in your app. With screen flows, you can look at a particular screen in your app and see both what users did while on screen and where they went afterwards. In looking at how users navigate your app, you can get a clear sense of problem areas, conversion road bumps, and drop off screens.
Screen flow analytics show you exactly what those users who didn’t complete a stage did instead, enabling you to fine-tune your app’s flow to increase conversions. With this data in mind, you can implement redesigns to create clearer funnels, or create in-app marketing campaigns to re-engage dropped users,
1.4.3. Start, Fail And Complete
Starts measure the number of times a player starts a new level. A fail occurs when a user starts a level but does not complete it. A complete counts the number of times users complete a certain level.
Are your choke points appropriately difficult? Are users getting stuck on certain levels unexpectedly? Which levels are users having the most fun playing and repeating? Starts, fails and completes can answer these types of questions.
1.4.4. Permission Granted To The App
A surprising yet important engagement-based KPI is when users grant permission for the app to access personal information. This information can include location information (which enables recommending a store nearby) or to share information to the user’s contact list. This KPI is important because it signifies a bond of trust between the user and the app which isn’t inherently given to every app.
1.5. Retention
1.5.1. Cohort Analysis
To calculate retention, separate your users into cohorts based on the day they download your app. The day that the download occurs is day 0. If a user opens your app the next day (day 1), they are marked as retained. If they do not open the app, they are not retained. This calculation is performed for user cohort on each day after they download the app. Common days used for retention are 1, 7 and 30.
Splitting out retention rate based on device, audience and campaign, or by custom dimensions like purchase frequency, you can experiment with what's working and what isn't in your app.
A retention rate can be calculated as: the number of players who return to the game 1,7 or 30 days after they started to play, divided by the number of all new players on the first day. By tracking this KPI, you'll be able to better predict how your app will grow and sustain its users.
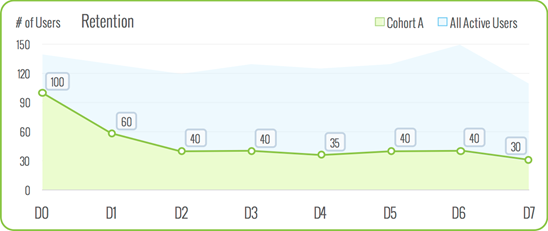
Retention for Cohort A can be calculated by following formula:
Day(X) Retention = Day(X) Users / Day 0 Users
And in the example it will be the following:
D1 = 60% | D2 = 40% | D3 = 40% | D4 = 35% | D5 = 40% | D6 = 40% | D7 = 30%.
To understand whether resulted retention good or bad, use this baseline that defines of 7-day (D7) retention rates in mobile casual games:
30% – amazing | 20% – good | 16% – average | 12% – poor | 8% – oh god, something’s wrong.
1.5.2. Session Length
Session length is measured as the period of time between app open and close, or when the app times out after 15 seconds. It indicates how much time your users are spending in your app per individual session. By segmenting your users, you can see which audiences are spending the most time in your app and why.
Tracking the length of user sessions is critical to unlocking revenue potential in your app flows. If you’ve got a eCommerce app, how long does your checkout flow take? If the average session length is five minutes and your checkout flow takes six, you need to either encourage users to stay in the app longer or simplify the checkout process.
1.5.3. Session Interval
Session interval is the time between the user’s first session and his or her next one, showing the frequency with which your users open the app. This can signal the immediate value gained from downloading and running the app. When you know the typical time lapse between sessions per user segment, you can better optimize the user experience to prompt regular opens.
For example, if you notice that tablet users have longer session intervals than smartphone users, it might be that you need to improve screen flow or design in your tablet app. That could lead to a positive change in terms of shortening the interval between sessions for those tablet users. It could also be an indication that you should consider adding contextual in-app or push messaging to prompt more immersive and frequent interaction.
1.5.4. Session Counts
Session counts are a basic unit of measurement for app engagement. Most app owners want their app to be so engaging, a user never puts it down. But, in order to engage with an app, a user has to launch it. Each launch counts as a session* and looking at session lengths help app owners quickly understand if users are actually using their application.
1.5.5. Daily Sessions Per DAU
Daily sessions per DAU gives you an idea of how often your customers make use of your app within a single day. This can help you determine whether your customers are returning to your app as often as you’d like them to be. Social media apps, for instance, might like to see their active users opening the app for a couple sessions a day.

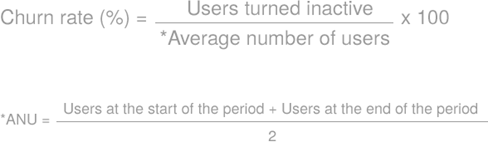
1.5.6. Churn Rate
Churn is the opposite of retention. How many players that downloaded your game are no longer playing? In a free-to-play game some users may play multiple times per day, while more casual players log in once or twice a week. To generalize for these differences between users, measure churn as a user who has not played in 28 days.
Your churn rate is the amount of users who stop playing your game during a given time period:
1.6. Referral
1.6.1. Invite Rate
The invite rate measures the average time it takes for a new acquired user, who just installed the app, to send an invite to another person. The higher the invite rate, the faster your app will grow.
1.6.2. Cycle Time
This is the average amount of time between when an existing user initiates a ‘referral’ (invites a new user to the app), and the moment the new user downloads the app. The shorter this period is, the faster you grow.
1.6.3. K-Factor
The k-factor is the measure of viral growth. A k-factor of 1 means you’re gaining one player through one existing player, and your game is neither growing nor declining. A k-factor of less than 1 means that your game requires marketing efforts, else it might run out of players.
While a k-factor greater than 1 means that your game is growing exponentially. Most of the games usually have a k-factor that is <1, as most of the games do not grow exponentially.
In terms of virality, the k-factor measures the ‘infections’ caused by one infected player. For example, if your k-factor is 0.5, then each “infected player” will infect 0.5 other players (and cause them to download/play your game). This however is not a true measure of virality because there are many more factors, usually uncertain and unpredictable, that lead to the virality.

(e.g. if each new customer invites five friends, i = 5)

(e.g. if one in five invites converts to new users, c = 0.2)

1.7. Revenue
1.7.1. Conversion Rate
The conversion rate measures the percentage of unique users that has made a purchase out of the total numbers of users that time period. You also need to measure the conversion rate of ads served in a free-to-play game.
To calculate the conversion, separate your users into cohorts on the day you start measuring. If a user makes a purchase within that time period, they are marked as converted. This calculation is performed for user cohort on each day within that time period.
Common days used for conversion rates are measured by a time period of 2, 7 and 30 days. Splitting out conversion rate based on device, audience and campaign, or by custom dimensions, you can experiment with what's working and what isn't in your app.
The conversion rate can be calculated as: the number of players who make a purchase in the game within the measured time period, divided by the total numbers of players. By tracking this KPI, you'll be able to better predict how your app monetizes user behavior.
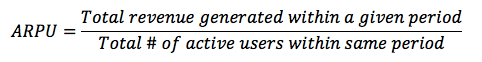
1.7.2. ARPU (Average Revenue Per User)
Average Revenue Per User measures the total monetization of active users with the same period. The main difference between ARPU and LTV is ARPU does not project how newly acquired users will monetize in the future. An ARPU of a certain value does not guarantee a financially successful game; it's all relative to the cost of acquiring users.
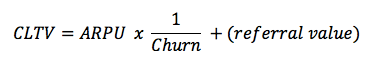
1.7.3. Customer Lifetime Value (CLTV)
Customer Lifetime Value is your primary revenue metric, representing the financial value of the app and how much each app user or customer is worth in his or her lifetime. It can be split out by average monthly value or value per customer, capturing worth over time financially and also in terms of loyalty and evangelism.
Customer Lifetime Value tells you how much each new customer is worth in his or her lifetime. It can be used as an indication of how much you can pay to acquire a customer. For example, if your CLTV is $2 while it costs $3 to reach a new user, you shouldn't acquire any users from this channel because you'll lose $1 per new user.
Use the following model to calculate a customer’s lifetime value:
1.7.4. Source, Sinks And Flows
Keep track of the sources, sinks and flows of the app. Tracking all the sources and sinks of virtual currency will enable you to balance your virtual economy and determine if you are being too generous or stingy with how much currency users receive from grinding. Knowing how often users purchase each item in your storefront will allow you to create new content that users will value.
Sources are places where users can earn virtual currency. A sink is the opposite of a source. These are the locations where users spend their currency. Both sources van refer to hard and soft currency. Combining sources and sinks gives you the flow. Flow is the total balance of currency that your players have spent and earned.
2. Sources
Author: Marvin Oltmans
For any questions, please contact me via Skype: "Marvin.Oltmans"
Read more about:
BlogsAbout the Author(s)
You May Also Like