Daily news, dev blogs, and stories from Game Developer straight to your inbox
Sponsored By
Featured Blog | This community-written post highlights the best of what the game industry has to offer. Read more like it on the Game Developer Blogs.
This is what the Global Game Jam 2016 lefts us
A statistical analysis of Latin American participation in last GGJ16.
7 Min Read

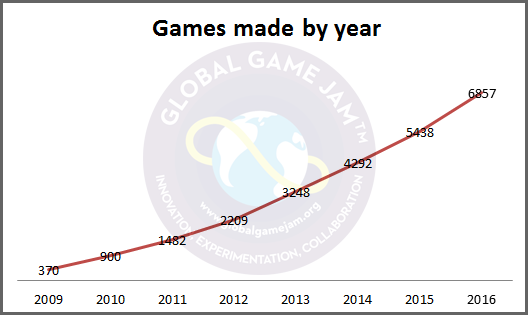
A new edition of the Global Game Jam has come to an end. The event, which took place between the 29th and the 31st of January, is considered one of the largest in the world within the video game industry. And this year, not only did it break attendance records, but it also increased the number of sites and games made, and the food consumed almost reached the Guinness Record!
In 2009, the first Global counted on the participation of 23 countries and 370 games were made. Fortunately, the number of games presented during the last edition grew to 6857 in 48 hours by 93 countries. In average, there were 73 games presented this year… Not bad if we compare this number with the 16 games made in 2009 by each country!
It is true that quantity does not mean quality and surely many of the productions do not reach the qualifying of "good". But remember that the spirit of this event is not about making the best game in the world, but about meeting new people in the business to work on a proposal. If this team work is successfully achieved, the participation and the project will definitely worth.
But this article is not about the spirit and meaning of the GGJ, so let’s discus some numbers obtained.
To begin with
Although according to the organizers the number of participants was of 93 countries, the data shown in the official web page said 95. What it may have happened is that the remaining two were not able to formalize the creation of their own site and, therefore, did not enter in the final count.
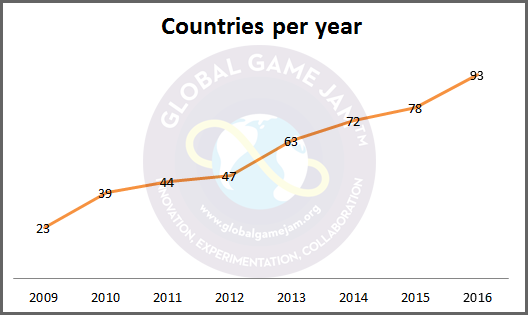
So, 93 countries against 78 who participated in the 2015 is a significant growth of 19%.
I would also like to highlight the first time participation of Paraguay (1 site, 6 games and 56 registered jammers) among other South American countries that took part of the event.
.png/?width=443&auto=webp&quality=80&disable=upscale)
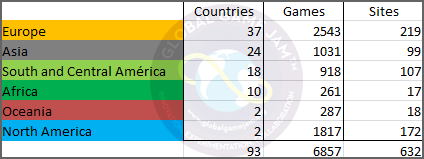
Grouping the countries by continent numbers are as follows: Europe: 37 countries; Asia: 24; South and Central America with 18; Africa with 10 and last Oceania and North America each of them with 2.
This time I'd like to focus South and Central America because it is the region I feel closer to with Puro Games, a TV program I produce and lead with news updates about Latin American video games, and I'm also interested in observing the development in this part of the world.
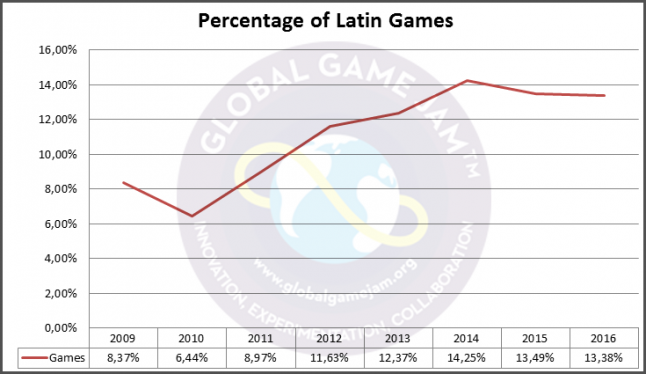
It's not bad that the number of games of Latin American countries in the last edition of the Global Game Jam represents the 13.38% of total games (113 games less than Asia, who had six more countries). But if we consider that the total percentage of games provided by Latin America in 2015 was of 13.49% of all games, with the absence of 3 countries, there wasn’t actually a significant growth. There were more countries, more sites, more participants, more games (+25%) and also an increased in the participation of Latin American countries compared to previous years; and still then, the "quota" provided was reduced an 0.11%.
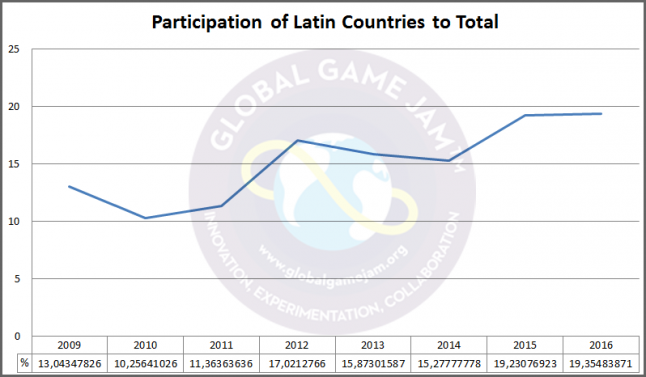
If we look at the results thrown since 2009, we can see that the highest point of contribution of games was in 2014 with 14.25%. We are talking about a reduction of 0.87% since that year.
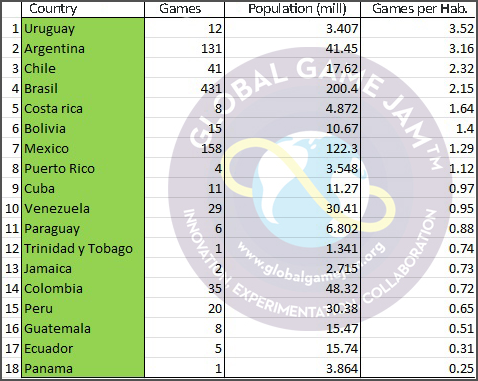
The number of games made in the GGJ 2016 by country in Latin America is as follows:
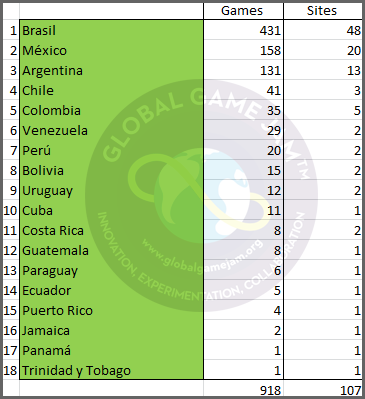
There were also 3 Latin American countries who managed to settle in the TOP 20 games production: Brazil (3rd), Mexico (11th) and Argentina (15th). The following Latin American country on the list is Chile, ranked 30th.
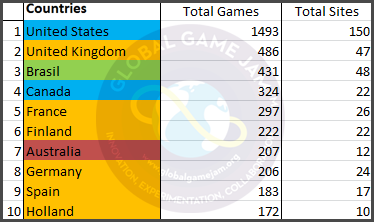
The TOP 10 is composed of six European countries, two American, one from Oceania and one from Latin America.
Where do we come from and where do we go
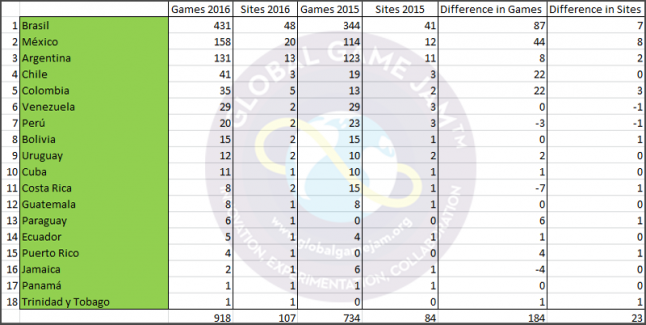
In Latin America there were 184 games more than 2015 and 23 sites were joined. The country that joined more sites was Mexico (8), followed by Brazil (7) and Colombia (3). In comparison to 2015, the country that showed the highest growth in production was Colombia, which went from 13 games made in 2015 to 35 in the last edition, showing an increase of 169%. The other country that also had a marked growth in this area was Chile, who moved from 19 games in 2015 to 41 games in 2016, raising their production a 115%.
Another protagonist that stood out is Mexico, which went from producing and presenting 114 games in 2015 to 158 games in 2016 (an increase of 38.5% in their creations) and ousted Argentina from the second place obtained in 2015, which produced only 8 more games this year.
Unfortunately, we have to say that the lowest performance in this Jam in Latin America was Costa Rica’s, which reduced considerably its production during 2015. Its participants made 8 games in 2 locations, while last year the numbers were 15 and 3. Jamaica and Peru also reduced their game production numbers. Worldwide speaking, the country where no games were produced was Cambodia, having only one site with one participant.
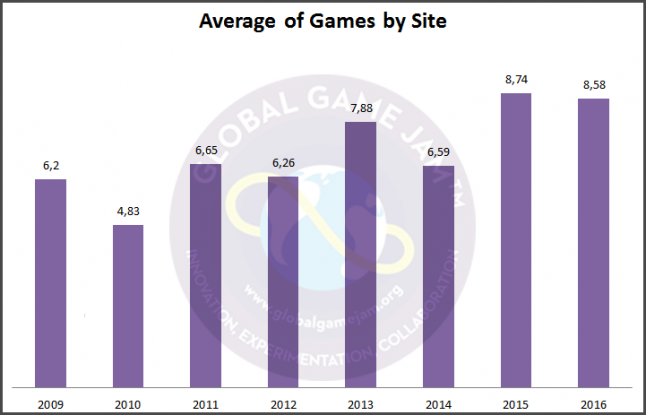
The average of games made by site in Latin American was 8.58. Compared to 8.74 in 2015 it gives us a minimum downward trend, but we should not worry about these decimals, especially considering that since 2009 this number has been suffering from some strange variations.
Another interesting fact that emerges from the Global Game Jam refers to games development according to the number of the population. In the first place, and far away from the second, is Finland ranking with 40.81 sets per number of inhabitants (5,439,000). The second place is occupied Lithuania 31.79 (2,956,000) and complete the podium Netherlands with 27.22 sets per number of inhabitants (6,318,000). The first Latin American country that appears is Uruguay, ranked 27th, with an average of 3.52 games for its 3,407,000 inhabitants. Latin American ranking is composed as follows:
To sum up
There is many more data that could be presented based on what has been already collected, and interesting trends could be predicted by comparing the 2016 edition of the event with previous years.
This research does not intend to be alarmist regarding the downward trends noted in some graphics but quite the opposite: it is undeniable the impetus that Latin America participation has in this event. Regardless of small ups and downs, we can see that the majority of the data shows a stable and promising trend, with participation growing little by little but knowing that every new contribution helps strengthening the role played by the Latin American community in each new edition of the Global Game Jam.
The incorporation of new countries and the higher number of sites within already existing participants prove the continuously growing interest in game development. This trend inevitably affects the private sectors, which incorporate new professionals to the industry and strengthen ties between countries.
In this regard, I would like to highlight the outstanding evolution of Latin American countries, which is shown in the Global and the participation in the world industry. Nowadays it is no surprise to find out that a recognized game was made in Mexico, Chile, Argentina or Uruguay, and it does not seem unusual either to find names of Latin American game companies competing head to head with various international studies.
We are tired of listening that the Latin American industry is in “growing process” never reaching its state of "maturity". In fact, there is probably a long journey ahead. But considering the statistics presented above I’m convinced about the fact that we are closer than ever to the place that the global industry has for us.
It's just a matter of time.
(*All data were extracted from the official website of Global Game Jam. Graphics were done by the author)
Read more about:
Featured BlogsAbout the Author(s)
You May Also Like
Latest News


Trending


Featured Blogs