Daily news, dev blogs, and stories from Game Developer straight to your inbox
Sponsored By
Featured Blog | This community-written post highlights the best of what the game industry has to offer. Read more like it on the Game Developer Blogs.
How Much Money Will Your Mobile Game Make?
Learn professional techniques used to forecast the potential revenue of F2P mobile games including key performance indicators, how to estimate the size of your market, and actual genre based metric values you can use to get accurate sales estimates.
9 Min Read

How Much Money Will Your Mobile Game Make?
“When we ship this game, we’re going to be rich!” is a sentiment we game developers often kid ourselves with. While millions of dollars would be nice, in reality, most of us would happily settle to see our game entertain a loyal fan base and make just enough money so we can be daring enough to do it all again.
Regardless of whether you want to make it big or make enough to live, it is always practical to prepare a revenue forecast. Making a game costs a lot of time and money. Knowing your potential revenue will help you evaluate the risk-vs-return soundness of your business plan and empower you to make smart decisions about the product you’re building.
If you’re developing a game for mobile, the best way to hedge your bet is to build a F2P (free-to-play) title with a SAS (software as service) model. While premium titles can have success, the lion’s share of revenue in the mobile market is made in micro transactions because the mindset of the mobile gamers trends towards low-demand and high-frequency interactions with a game they love to come back to. A premium title must sell the customer before they buy the game — a F2P title proves to the customer that their game is worth investing in and keeps them engaged. With this in mind, here are 5 tips to help you determine how much money your mobile game will make.
1. Know your KPI’s
KPI stands for key performance indicators. These are the metrics that enable you to measure the effectiveness of your product and its potential return on investment. For determining a F2P forecast, there are two essential industry-standard KPI’s: DAU and DARPU.
DAU stands for Daily Average User and represents the number of unique people that play your game each day. DARPU stands for Daily Average Revenue Per User and represents the average revenue your game generates per day divided among all players. For example, if your game makes $4K per day and you have a DAU of 11K per day, you would have a DARPU of $0.36.
If you know your DAU and DARPU, you can calculate your gross revenue forecast by multiplying them by the total number of days in the game’s life cycle. I use 18 months as a conservative estimate for a game’s life cycle as the majority of lifetime revenue will typically be made in this time period.
F2P Game Gross Revenue Forecast = DAU * DARPU * 30 days * 18 months
2. Use Genre Market Segments to Estimate Revenue
Estimating your forecast is a snap if you know DAU and DARPU, but how do you know what your DAU and DARPU numbers should be? Working in the AAA mobile games industry, I’ve learned that these numbers typically correspond to the game genre. For example, niche/core titles such as roleplaying games (Summoners War), collectible card (Hearthstone) and strategy games trend towards lower DAU and higher DARPU while casual/mass appeal titles like physics puzzles (Angry Birds), brain teasers and matching puzzle (Candy Crush Saga) trend towards higher DAU and lower DARPU.
DARPU Estimates by Genre
Casual/Mass Appeal: $0.02-$0.06
Mid-Core Genres (non-combat city builders, simulation): $0.10-$0.20
Niche/Core Genres (combat builder, CCG): $0.30-$0.040
Here’s a contrast between of DAU/DARPU for two different genres with a forecast of $1.08MM for 18 months:
Niche/Hardcore: DAU 10K, DARPU $0.35, $3.5K/day
Casual/Mass Appeal: DAU 175K, DARPU $0.02, $3.5K/day
It makes sense right? Hard core players are typically invest more time and will spend more on a game they love — but the number of players these kinds of games appeal to is much smaller than mass appeal games.
3. Create a Facebook Ad Campaign to Estimate Market Reach
The more specific you can be about the audience your game will appeal to, the better your forecast estimate will be. Saying that your game appeals to all ages between 8–80, for example, is too broad to understand how your game will generate revenue. Be specific. “I’m making a game for 25 to 34 year-old male gamers, married with kids, who like Dungeons and Dragons and Magic the Gathering who live in North America.”
A great trick to estimating market reach is to create a Facebook ad campaign. See Fig 1. Facebook Audience Definition.
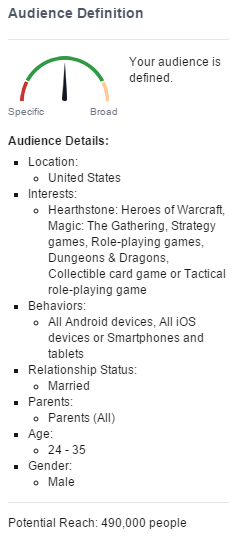
Fig 1. Facebook Audience Definition
Now that you’ve got some idea on audience size, you can set a target for your launch installs. For the game I’m building, with market focus size of 500K, I’m aiming for a launch month install base of 150K.
While the aim of F2P is to run your game as a service for 5+ years with users will be installing your game throughout this time, the launch month installs are important for forecasting because it’s this initial cohort of players that most accurately predicts your potential success. Most mobile game install curves look like this:

Fig 2. Typical F2P Mobile Game Install Curve
In Fig 2, months 1–6 represent “soft-launch” testing, while month 7 represents worldwide launch. Note how the curve dramatically tapers than trails off. This is what a typical F2P launch looks like (assuming no added content, which would result in spikes/waves on the tail end.)
Your initial install base is known as your “golden cohort” — these are the players with highest potential to become invested players, to champion your game, and become long-term fans. For an indie title, your launch month installs may comprise 40% or more of your life-time installs. Knowing your target launch installs can help you predict DAUs if you also know your retention.
4. Use Retention and Launch Installs to Predict DAU
Retention is a KPI metric that helps measure how engaging your game is. It is represented as a percentage. For a given cohort (group of players that installs on a given day) retention is the percentage of those players that return to play your game. The “big three” retention days measured are D1 — or the percent of players that return to play the next day after downloading, D7 (players that return after a week), and D30, is the percentage of players still playing a month after downloading.
D1 typically reflects how effective your first-time user experience is. Were the controls effective? Did players understand the objectives? Was the player excited enough to come back and play again? If you can get 50% of the players who download your game to come back the next day, you’ve done well by industry standards. D1 is important because it sets the maximum for how many users will funnel into long term gameplay.
D30 reflects percentage of users that are engaged for the long haul and numbers of 8% or better are considered very good. With your first month installs number, retention rates, and some spreadsheet distributions, you can predict your DAU. Complicated-to-explain calculations aside, a quick and dirty short-cut estimate is:
DAU ~= Launch Installs * D30 retention percentage
So for example, if my game gets 150K installs in first 30 days and has a D30 retention rate of 8%, I predict it will have an average DAU of 12K players per day.
5. Use Buyer Psychology to Make Sense of Daily Revenue
Earlier, I explained that:
Average daily revenue = DAU (Daily Average Users) * DARPU (Daily Average Revenue Per User)
DARPU can be difficult to estimate without intimate industry knowledge of game genres because it’s a derived average rather than a real spending scenario that you can picture in your head. When you think about your purchases made in mobile games (take Hearthstone for example) do you think to yourself, “I spend an average of 36 cents a day.” or do you think — “When I make a purchase, I buy the 15 packs for $20 because it’s the best value without breaking the bank?” Let’s assume all Hearthstone players thought this way about purchases. In that case, $20 would be an accurate representation of a metric is known as DARPS, or Daily Average Revenue Per Spender.
I like to forecast using DARPS vs. DARPU for that exact reason. It’s easier to justify how the monetization will work. To do this, you take your DAU and multiply this by Spender Conversion (the percentage of your daily players who make the awesome decision to purchase that day) to yield “Average number of spending players per day”. Spender conversion for F2P is low, typically less than 1%, but trends higher for niche/hardcore games, 2.5%-4%. So, simply take your average daily spenders and multiply that by the “magic average number” you think they’ll spend and you’ll get average daily revenue.
Average daily revenue = DAU * Spender Conversion * DARPS
Similar to before, you can multiply your average daily revenue on a monthly projection (I use 18 months) to yield gross revenue forecast:
Gross Revenue Forecast = Average daily revenue * 18 months * 30 days
This gives you the maximum potential your product is expected to generate in revenue over its lifecycle, but remember, for F2P titles launched in the mobile app stores, there is a 30% platform fee for all transactions. Running your live service also has a COG (Cost of Goods Sold) attached with data/server costs that scales based on DAU. So let’s take these into account:
COG (Cost of Goods Sold) = (DAU * 18 * 30) * Server Cost @(0.006/per DAU)
Net Revenue = (Gross Revenue * 70%) -COGs
For example, in my forecast, with a target DAU of 11K users, spend conversion of 2.5% and average spend of $15, my game could potentially yield $4K / per day or 2.2MM lifetime revenue. After app store takes their cut, and data costs COGs are paid, net revenue is around $1.5MM.
So, is it worth the risk for me to invest in my business building this game? Well, that’s just net revenue, not operating cost — what will the game cost to make? Also, how can I be sure I’ll hit my forecast targets — and what happens if I don’t?
These are topics for future articles, but for now, we’re one-step closer to having realistic business expectations about how much money a mobile game can make.
Read more about:
Featured BlogsAbout the Author(s)
You May Also Like