Daily news, dev blogs, and stories from Game Developer straight to your inbox
Sponsored By
Featured Blog | This community-written post highlights the best of what the game industry has to offer. Read more like it on the Game Developer Blogs.
Everything you need to know about interpreting KPIs
As independent game designers, we want to focus on game creation. Sales and marketing related domains often feel foreign to us. Yet, to make a living, we do have to think as a company sometimes. That is when Key Performance Indicators come in.
10 Min Read

This tutorial was originally published on the GameAnalytics blog

As independent game designers, we generally want to focus our mind on game creation. Sales and marketing related domains often feel foreign to us. Yet, to make a living, we do have to think as a company sometimes. Once we know how to make games, we have to learn how to market and sell them. On a market where 100s of titles are released each day, we cannot just rely on our games’ quality to magically attract users.
There are 12,000 games released on the US apple store each month. More than 400 each day on a single platform. Although they are of varying quality, the concurrence is fierce and it is hard to get visibility. More important even, is the fact that as a team, we want to rely on luck as little as possible: the risk isn’t only on our shoulders, but also on our teammates’.
As a business, we have some objective tools at our disposal to see where we are going. We can estimate the risk our work represents, and the precise objectives we have to reach in order to survive as a game company. Those tools are collectively called Key Performance Indicators, or KPIs.
What are key performance indicators?
KPIs are metrics that are used to measure the performance of your games, your products, or your company as a whole.
KPIs are metrics that:
Help you to evaluate the success of your game or your company.
Give you a broad understanding of your business’s current position.
Show your progress towards key goals.
Performance Indicators are quantifiable and relevant to a specific goal and relate to a project or an activity in your company. To put things in simpler terms, here is a clear, simple definition of a Key Performance Indicator: it is “a metric that helps you understand how you are doing against your objectives.” – Avinash Kaishik.
The same author exposes the goals you should be looking to achieve in an interesting way. He says that “The objectives must be DUMB: Doable. Understandable. Manageable. Beneficial.”
It is important to note that KPIs are not some kind of shady marketing concept. They are indicators that your whole team will use. Those metrics are often broad and easy to understand.
For example, you may be looking to target new players with your next game. Before the game is released, one key performance indicator would be your subscriber count’s growth on social networks. As a company, you may want to increase your revenue to create bigger and better games. 2 KPIs to track in that case could be the amount of new weekly customers and how much each customer spends on your products on average. Those are streams of data each employee in your company can understand.
When it comes to your games themselves, your KPIs will most of the time boil down to your User Analytics.
The research team here at GameAnalytics analyzed more than four hundreds games’ retention, conversion and revenue related metrics. Their study gives us a few interesting pointers as far as a game’s financial success is concerned:
The future success of a game can be measured before its release.
There are 2 metrics top-tier games show excellent results with: retention and conversion. ARPPU (Average Revenue Per Paying Users) is also meaningful whenever your game features In App Purchases.
The Golden Cohort, that is to say your first players, can make or break the success of your game.
Those are easy to track, high-level KPIs. Below, I try to compile a list of some general metrics that can be relevant for most game projects.
High level Key Performance Indicators for Game Developers
Let’s start with the 2 key metrics mentioned above: retention, and conversion. Your retention corresponds to the percentage of users who came back to your game after 1 day, 2 days, 3 days… It can be calculated in multiple ways, but Game Analytics uses the classic method, which is pretty telling as far as your long-term retention is concerned.
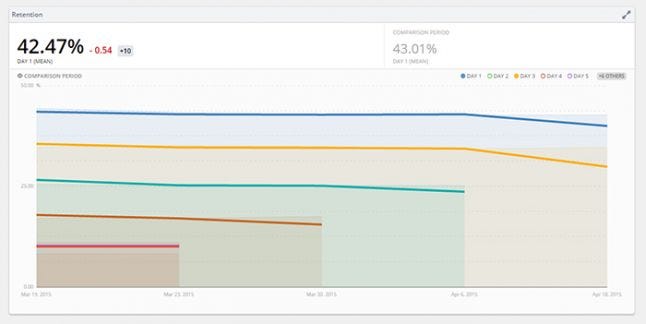
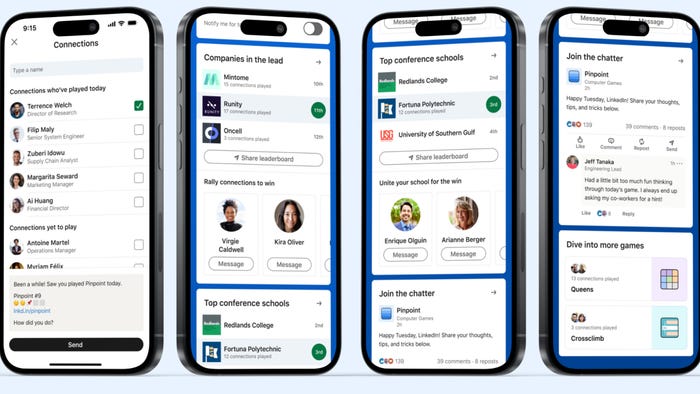
Game Analytics offers an easy access to all of the most common high-level metrics.
Conversion, on the other hand, simply is the proportion of players who invest money into your game. This can be users who buy your full game from your demo or lite app version, all simply players who buy an in game object in the case of the free To Play title. That is a metric that can be used at different levels into your games are applications. You can calculate the conversion rate for each paid item in your game to see which ones sell the best.
Another very common metric is the churn. It is the opposite of your retention: the churn of an app corresponds to the proportion of players who stop playing altogether. Retention + Churn = 100%.
Among the simplest KPIs, we also have MAU and DAU. Respectively Monthly and Daily Active Users. Those 2 are general metrics that permit you to keep track your user base over time. A high and steady DAU characterizes a healthy game.
Along the same lines falls the amount of new daily or weekly users. It is always interesting to know how many people are installing the game every week, and to see how this value evolves. Once again, if you’re gaining more and more new organic daily users, it means that your game is pretty healthy.
There is another straightforward metric that can give you an idea of how pleasant your game is: the Average Session Length per User. The distribution of your session length can also be useful. That is to say observing what proportion of game sessions last less than 5 minutes for example, and how many last for more than 5 minutes. In other words, it is interesting to monitor the proportion of users who play for a long time compared to those who leave the game pretty fast.
The specifics of Free to Play games
In practice, you will rarely need to track many KPIs if you make single-payer games. In particular, tracking the profits made by a single-payer game is a straightforward process: each person who buys the game spends the same amount of money. Chances are the game won’t have any operating cost. Once your gross revenue outweighs your game’s budget, it is profitable.
Free to play titles, on the other hand, require a constant stream of users to spend money while playing to be profitable. Studios which make Free to Play games often have to invest a certain amount of money in ads in order to keep reaching new users. So each person who downloads the game has at least a virtual cost called CPI (cost per install).
The CPI can be used in conjunction with another metric to monitor the financial success of your projects: the LTV (lifetime value). That is comparing how much money it cost you to get a user to install your game and how much they spent on it and return. We use those values to calculate the Return on Investment of a game: ROI = LTV - CPI. If this value falls down in the negatives, it means that you are keeping the game alive at a loss.
ARPU (Average Revenue per User) and ARPPU (Average Revenue per Paying User, note the 2 “P”) are the 2 most common revenue related metrics for Free to Play titles. They are both key indicators of your profitability per user. Note that ARPPU will always be higher than ARPU. We also sometimes look into ARPDAU: the Average Revenue per Daily Active User.
Speaking of daily active users, there is another useful metric that pushes the analysis of users sticking to your application: what we call the Sticky Factor. The Sticky Factor is calculated by dividing the Daily Active Users by the Monthly Active Users: Sticky Factor = DAU/MAU. A sticky factor of 0.1 or 10% means that for each new player that starts playing your game, you have 10% chance to turn him into a daily user. And your daily users will be the ones who will most likely spend money on your game.
How many KPIs should we track as game developers?
It is key to not spend too much time focusing on Performance Indicators. If they are a great tool, they shouldn’t distract us from creating good games (which is the safest way to be successful as a game studio). And from keeping in touch with our players.
It isn’t necessary to track many! A few relevant metrics are enough to get a good sense of your progress towards any given objective. And although KPIs will give you solid insights about your business, you shouldn’t spend too much time tracking them. For one, you want to filter the metrics that are the most relevant to your specific goals. But you also want to define the frequency at which you are going to get updates on them.
Thankfully, when it comes to games, a tool like Game Analytics takes care of the tracking for you. You will just have to come every day or one time a week to check the evolution of your statistics. Google analytics will give you lots of insights on your website. And social networks also offer detailed analytics nowadays. So you don’t have to keep tracking too much data by yourself, even aside from your game’s user analytics.
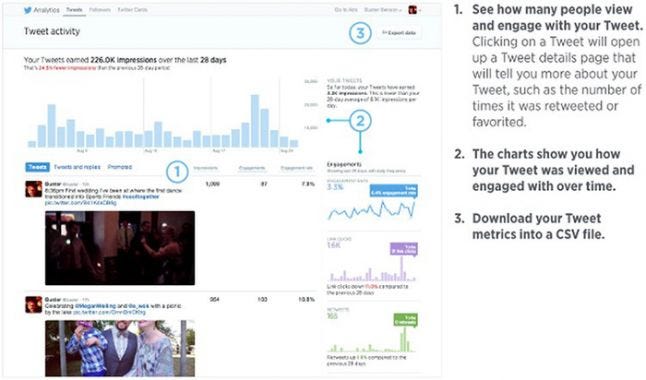
Twitter, just like facebook and Youtube, offers detailed analytics on your tweets. Some of those metrics can be tracked as Performance Indicators.
How to properly use Key Performance Indicators
Until now, we talked a bit about what’s KPIs are, and took a look at a few common high-level metrics. As I told you before, the performance indicators you decide to pick should be specific for each of your projects. So instead of telling you which ones you should use here are some simple steps you can take to pick the right Performance Indicators for your project.
To properly use KPIs you need to:
Find a desired objective for your game or business. I.e. doubling your website’s traffic over 6 months.
Dissect the steps you need to take to reach that goal. How could you improve your development blog? Should you start making weekly video updates?
List the data you need to monitor to track your progress towards that goal. What keywords do your users search for online? How well does each of your article spread on social networks?
Keep your strategy on check: come back to and observe the evolution of each stream of data at a fixed frequency. Was every metric relevant in the end? Don’t hesitate to take out the ones that proved superfluous or to add other ones.
Summary
As you have certainly noticed, Key Performance Indicators are pretty simple. If you keep making a specific genre of games, chances are you will end up reusing the same indicators again and again.
If you should only remember a few things about KPIs:
They help you to monitor your progress towards DUMB objectives (“Doable. Understandable. Manageable. Beneficial.”)
They should be simple enough so that everyone can understand them
This tutorial was originally published on the GameAnalytics blog
Read more about:
Featured BlogsAbout the Author(s)
You May Also Like