Daily news, dev blogs, and stories from Game Developer straight to your inbox
Sponsored By
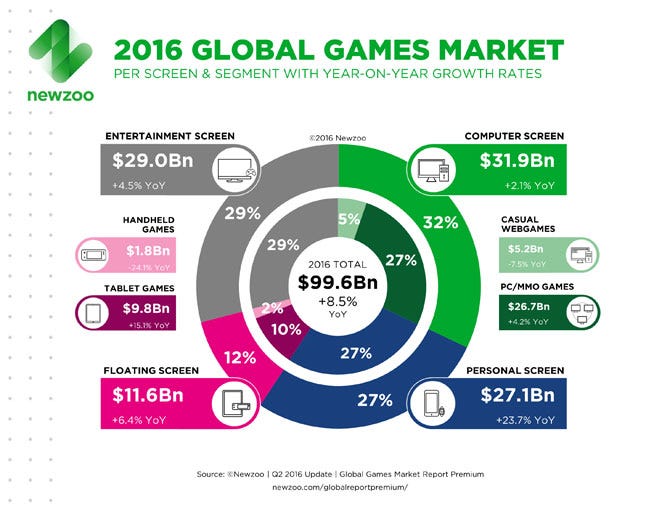
See just how revenues split across PC, mobile, console, and handheld
Analyst firm Newzoo breaks down just how much people spend -- and will continue to spend -- on all kinds of games.
1 Min Read

Left wondering how much money players spend on games, and how they compare? Analyst firm Newzoo has released its quarterly game industry report, and it contains a breakdown of the industry into four segments:
The computer screen (PCs)
The entertainment screen (consoles)
The personal screen (smartphones)
The floating screen (tablets and handhelds)
The last segment has shrunk as compared to earlier projections, Newzoo says, thanks to the decline of handheld games and tablets. Tablets are declining, the firm says, because phones are getting bigger, and eating into their revenues.
Newzoo also suggests that, as yet, VR does not represent a new segment, but is part of its parent platforms (console, PCs, and mobile, in other words).
You can see the breakdown of revenues below, with further breakdowns in the categories. You can read more about the data over at Newzoo's blog. And if you're interested in exactly how Newzoo comes up with these numbers, you can read about its methodology here.
About the Author(s)
You May Also Like