Daily news, dev blogs, and stories from Game Developer straight to your inbox
Sponsored By
Featured Blog | This community-written post highlights the best of what the game industry has to offer. Read more like it on the Game Developer Blogs.
I’m going to look at the history of the science of human color perception science leading up to the new HDR video standards and also try to explain some of the terminology that is commonly used.
18 Min Read

I’m going to look at the history of the science of human perception science leading up to the modern video standards and also try to explain some of the terminology that is commonly used. I’ll also briefly touch on how the pipeline of a typical game will be more and more like the one used in the motion picture industry.
Pioneers of color perception
We know today that the human retina contains three different kinds of photoreceptive cells called cones. The three kinds of cones each contain a member of the protein family known as photopsins which absorb light in different parts of the spectrum:
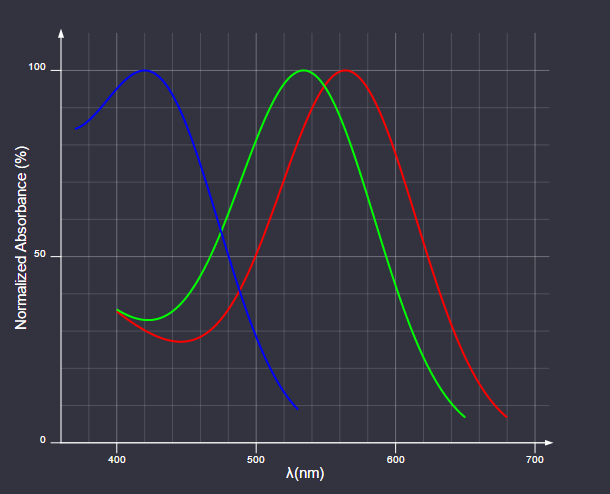
Photopsins absorbance
The cones corresponding to the red, green, and blue parts of the spectrum are also often referred to as long(L), medium(M), and short(S), indicating which wavelengths they are most receptive too.
One of the earliest treatise of the interaction of light and the retina can be found in “Hypothesis Concerning Light and Colors” by Isaac Newton, probably written sometime around 1670-1675. Newton theorized that light of various wavelengths caused the retina to resonate at the same frequencies and that these vibrations were then propagated through the optic nerve to the “sensorium”.
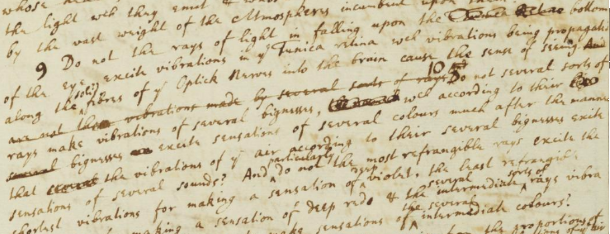
Do not the rays of light in falling upon the bottom of the eye excite vibrations in the Tunica retina which vibrations being propagated along the fibres of the Optick nerves into the brain cause the sense of seeing. Do not several sorts of rays make vibrations of several bignesses which according to their bignesses excite sensations of several colours…
(I highly recommend having a look at the scans of Newton’s original drafts available at the Cambridge University web site. Talk about stating the obvious, but what a frigging genius!)
More than a hundred years later Tomas Young speculated that since resonance frequency is a system dependent property, in order to capture light of all frequencies there would need to be an infinite number of different resonance systems in the retina. Young found this unlikely and further speculated that the number was limited to one system for red, yellow, and blue, the colors traditionally used in subtractive paint mixing. In his own words:
Since, for the reason here assigned by Newton, it is probable that the motion of the retina is rather of a vibratory than of an undulatory nature, the frequency of the vibrations must be dependent on the constitution of this substance. Now, as it is almost impossible to conceive each sensitive point of retina to contain an infinite number of particles, each capable of vibrating in perfect unison with every possible undulation, it becomes necessary to suppose the number limited, for instance to the three principal colours, red, yellow, and blue…
Young’s assumptions about the retina were not correct but he still landed in the right conclusion: that there is a finite number of categories of cells in the eye.
In 1850 Hermann von Helmholtz became the first to produce experimental evidence for Young’s theory. Helmholtz asked a test subject to match the colors of a number of reference light sources by adjusting the intensity of a set of monochromatic light sources. He came to the conclusion that three light sources, one in the red, one in the green, and one in the blue part of the spectrum, were necessary and sufficient to match all the references.
Birth of modern colorimetry
Fast forward to the early 1930s. By this time the scientific community had a pretty good idea of the inner workings of the eye (although it would take an additional 20 years before George Wald was able to experimentally verify the presence and workings of rhodopsins in the retinal cones, a discovery which would lead to him sharing the Nobel prize in Medicine in 1967). The Commission Internationale de L'Eclairage (International Commission on Illumination), CIE, set out to create a comprehensive quantification of the human perception of color. The quantification was based on experimental data collected by William David Wright and John Guild through a setup similar to the one pioneered by Hermann von Helmholtz. The primaries in the experiment were set to 435.8 nm for blue, 546.1 nm for green, and 700 nm for red respectively.
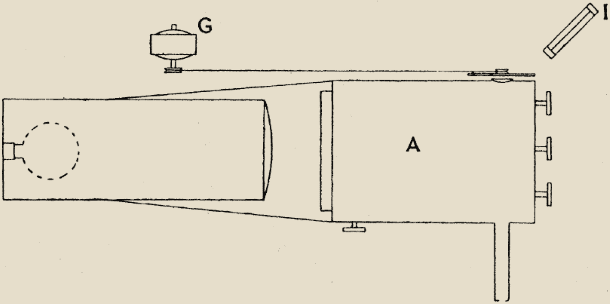
John Guild’s experimental setup, the three knobs adjust the primaries
Because of the significant overlap in sensitivity of the M and L cones, it was impossible to match some wavelengths in the blue to green part of the spectrum. In order to “match” these colors some amount of the red primary needs had to be added to the reference so that:

If we imagine for a moment that we can have a negative contribution from the primaries, this can be rewritten as:

The result of the experiments was a table of RGB triplets for each wavelength which when plotted looked like this:
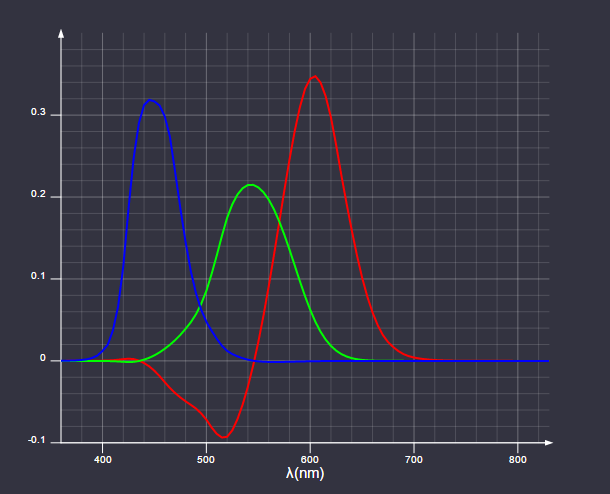
CIE 1931 RGB color matching functions
Colors with a negative red component are of course not possible to display using the CIE primaries.
We can now find the trichromatic coefficients for light of a given spectral power distribution, S, as the following inner product:

It might seem obvious that the response to the various wavelengths can be integrated in this way, but it is actually dependent on the physical response of the eye being linear in wavelength response. This was empirically verified by Herman Graßmann in 1853 and the integrals above are the modern formulation of what is now known as Graßmann’s law.
The name color space comes from the fact that the red, green, and blue primaries can be thought of as the basis of a vector space. In this space the various colors that humans can perceive are represented by rays through the origin. The modern definition of a vector space was introduced by Giuseppe Peano in 1888, but James Clerk Maxwell had already more than 30 years before this used the fledgling theories of what would later become linear algebra to create a formal description of the trichromatic color system.
For computational reasons the CIE decided that it would be more convenient to work with a color space where the primary coefficients were always positive. Expressed in coordinates of the RGB color space the three new primaries were:

This new set of primaries can’t be realized in the physical world and is only a mathematical tool to make the color space easier to work with. In addition to making sure the primary coefficients were positive, the new space was also arranged so that the Y coefficient of a color corresponds to its perceived brightness, this component is known as the CIE luminance (read Charles Poynton’s excellent Color FAQ for more detail).
To make the resulting color space easier to visualize we can make one final transformation. By dividing each component with the sum of the components we end up with a dimensionless expression of a color that is independent of its brightness:

The x and y coordinates are known as the chromaticity coordinates, and together with the CIE luminance Y they form the CIE xyY color space. If we plot the chromaticity coordinates for all colors with a given luminance, we end up with the following diagram which is probably familiar:
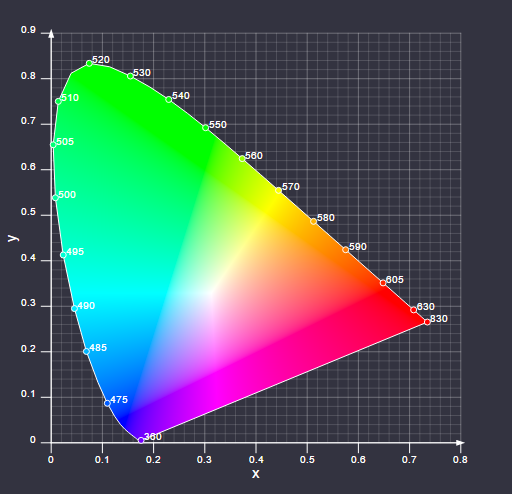
CIE 1931 xyY diagram
One final concept that is useful to know about is what’s referred to as the white point of a color space. For a given display system, the white point is the x and y coordinates of the color you get when you set the coefficients of your RGB primaries to the same value.
Over the years several new color spaces which in various ways improves on CIE 1931 ones. Despite this the CIE xyY system remains the most commonly used color space to describe the properties of display devices.
Transfer Functions
Before looking at a few video standards, there are two additional concepts that we need to introduce and explain.
Optical-Electronic Transfer Function
The optical-electronic transfer function (OETF) specifies how linear light captured with some device (camera) should be encoded in a signal, i.e. it is a function of the form:

Historically V would be an analog signal but nowadays it is of course encoded digitally. As a typical game developer you’ll likely not have to concern yourself with EOTFs that often; the one scenario where it would be important is if you plan to mix live action footage with CGI in your game. In this case it is necessary to know what EOTF your footage was captured with so that you can recover the linear light and correctly mix it with your generated imagery.
Electronic-Optical Transfer Function
The electronic-optical transfer (EOTF) function does the opposite thing of the OETF, i.e. it specifies how a signal should be converted to linear light:

This function will be more important for us as game developers since it specifies how the content we author will appear on our customers TVs and monitors.
Relation between EOTF and OETF
Though they are related concepts the EOTF and OETF serve different purposes. The purpose of the OETF is to give us a representation of a captured scene from which we can reconstruct the original linear light (this representation is conceptually the same thing as the HDR framebuffer of your typical game). What will happen in a typical movie production pipeline is then:
Capture scene data
Apply the inverse of the OETF to recover the linear light values
Color grading
Mastering for different targets (DCI-P3, Rec. 709, HDR10, Dolby Vision etc.):
Reduce the dynamic range of the material to match the dynamic range of the target (“tone mapping”)
Convert to target color space
Apply the inverse of the EOTF to the material (when the EOTF is applied by the display device, the image as intended will be recovered).
An in depth discussion of this pipeline is out of scope for this article, but I recommend that you check out the ACES (Academy Color Encoding System) workflow for a more formalized treatise of the pipeline described above.
Up until now a typical game pipeline has looked like this:
Rendering
HDR frame buffer
Tonemapping
Inverse EOTF of an assumed display device (typically sRGB)
Color grading
Most game engines use the color grading method popularized by the Naty Hoffman’s Siggraph 2010 presentation “Color Enhancement for Videogames”. The method was a practical choice when we only had to target SDR, and it also made it possible to use software that was already installed on most artists computers, like Adobe Photoshop, to do the grading.
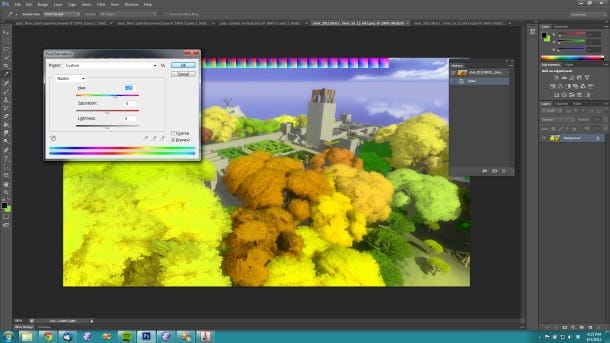
A typical SDR grading workflow (image courtesy of Jonathan Blow)
With the introduction of HDR, most games will probably start to move towards a pipeline similar to the one employed in movie productions. Even in the absence of HDR a movie like pipeline will be an improvement; doing the grading in HDR means you have the whole dynamic range of the scene available and some effects which were not earlier possible will now be.
We’re know ready to have a look at the various standards that are currently used to describe our TVs.
Video Standards
Rec. 709
Most of the standards relating to broadcasting of video signals are issued by the International Telecommunication Union (ITU), a United Nations agency mainly concerned with information technology.
ITU-R Recommendation BT.709, more commonly referred to as Rec. 709, is the standard describing the properties of HDTV. The first version of the standard was released in 1990, but as of writing the latest version is from June 2015. The standard covers things like aspect ratios, resolutions, and frame rates, but since these are things most people are already familiar with I’ll not linger on them and I’ll instead focus on the parts of the standard that concerns color and luminance reproduction.
Framed in the CIE xyY color space, the chromaticity part of the standard is well defined. The red, green, and blue light sources of a conforming display should be selected so that their individual chromaticity coordinates are:

Their relative intensities should be adjusted so that the white point has a chromaticity of

(This white point is also known as CIE Standard Illuminant D65 and is meant to capture the chromaticity coordinates of the spectral power distribution of average midday lighting.)
The chromaticity properties can be visualized as:
Rec. 709 gamut
The area of the chromaticity diagram covered by the triangle formed by the primaries of a given display system is known as its gamut.
We now get to the luminance part of the standard, and this is where things starts to get sticky. The standard specifies that the “Overall opto-electronic transfer characteristic at source” is:

There are two problems here:
There is no specification of what physical luminance L = 1 corresponds to
Despite being a standard for video broadcast, it doesn’t specify an EOTF
The way this has been handled historically is by saying that the display device, i.e. the TV, of the consumer is the EOTF. In practice this was handled by mapping the range of the captured luminance in the OETF above so that it looks good on a reference monitor with the following EOTF:

where a L = 1 corresponds to a luminance of around 100 cd / m² (the unit of cd / m² is referred to as a “nit” by people in the industry). This is acknowledged by the ITU in the recent versions of the standard through the comment:
In typical production practice the encoding function of image sources is adjusted so that the final picture has the desired look, as viewed on a reference monitor having the reference decoding function of Recommendation ITU-R BT.1886, in the reference viewing environment defined in Recommendation ITU-R BT.2035.
Rec. 1886 is the result of an effort to in the twilight years of the CRTs document their characteristics (the standard was published in 2011), so basically a formalization of the existing practice.
Where CRTs go to die
The nonlinearity of the luminance as a function of the applied voltage is the result of how the CRT is physically constructed. By pure coincidence this nonlinearity is (very) roughly the inverse of the nonlinearity of human brightness perception. When we moved to a digital representation of the signals this had the fortunate effect of spreading the error of the quantization sort of evenly over the luminance range.
Rec. 709 is specified to either use an 8-bit or 10-bit encoding. Most content use an 8-bit encoding for which the standard specifies that the signal should map the luminance range to codes 16-235.
HDR10
When it comes to HDR video, there are two primary contenders: Dolby Vision and HDR10. For this article I’m going to focus on HDR10 since it is an open standard and is quickest getting mainstream adoption, it is also the standard chosen for the Xbox One S and the PS4.
If we once again begin by looking at the chromaticity part HDR10 uses a color space that is specified in the ITU-R Recommendation BT.2020 (UHDTV). The chromaticity coordinates of the primaries are as follows:

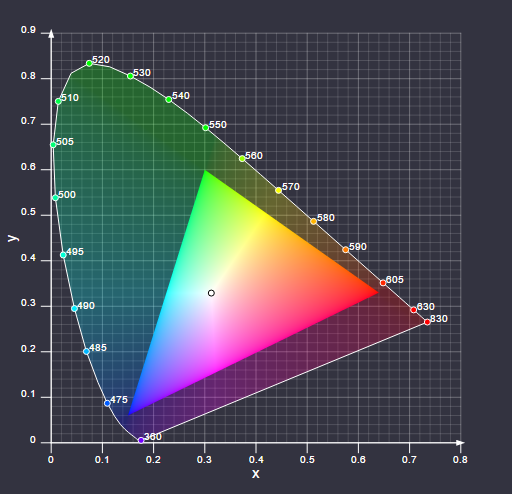
And once again D65 is used for the white point. Visualized in an xy diagram, Rec. 2020 looks like this:
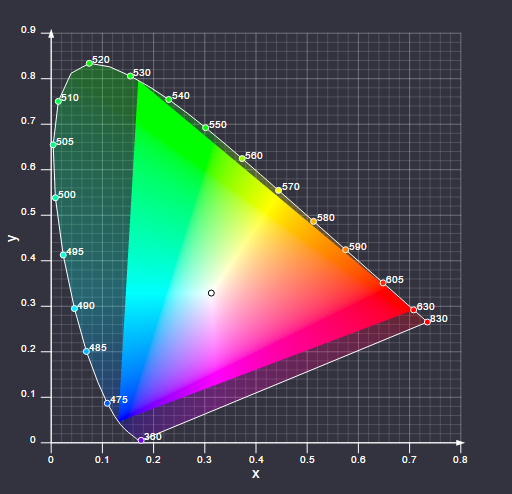
Rec. 2020 gamut
It is readily apparent that the gamut of this color space is significantly larger than that of Rec. 709.
We now come to the luminance part of the standard, and once again this is when things get more interesting. In his 1999 Ph. D thesis “Contrast sensitivity of the human eye and its effect on image quality” Peter Barten presented the following, slightly daunting, equation:

(Many of the variables in the equation above are themself complex equations, the luminance for instance is captured inside the equations for E and M).
The equation specifies how sensitive the eye is to contrast changes at various luminances, and the various parameters specifies the viewing conditions and also some properties of the observer. The “Just Noticeable Difference”, JND, is the inverse of Barten’s equation, so in order for a quantization of an EOTF to be free from banding under some viewing conditions, the following must hold true:

The Society of Motion Picture and Television Engineers (SMPTE) realized that Barten’s equation would be a good foundation for a new EOTF and the result is what is now known as SMPTE ST 2084, or more commonly the Perceptual Quantizer (PQ).
The PQ was constructed by selecting conservative values for the parameters of the Barten equation for what is expected to be the typical viewing conditions of the consumer. The PQ is then defined as the quantization that for a given luminance range and number of samples follows the Barten equation with the selected parameters the closest.
The quantized values of the EOTF can be found through the following recurrence relation by finding a k < 1 such that the last value of the quantization is the desired max luminance:

For a max luminance of 10,000 nits using a 12 bit quantization (this is what’s used by Dolby Vision), the result looks like this:
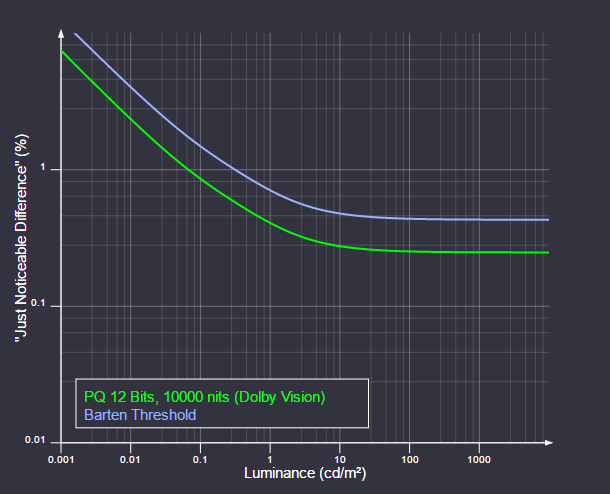
The perceptual quantizer EOTF
As you can see this quantization is free from banding over the entire luminance range.
The HDR10 standard also uses the PQ EOTF but with 10 bits. This is not enough to stay below the Barten Threshold over a 10,000 nits luminance range, but the standard allow for meta data to be embedded in the signal so that the peak luminance can be dynamically adjusted. Here’s what a 10 bit PQ quantization looks like for a few different luminanceranges:
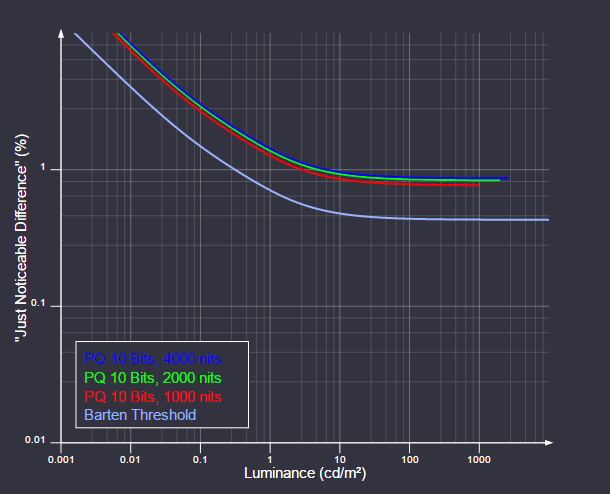
HDR10 EOTFs
Even so, this is still a bit above the Barten threshold but the situation is not as dire as the graph might indicate since:
The curve is logarithmic, so the relative error is actually not that large
Remember the parameters used to generate the Barten threshold were chosen conservatively.
As of writing TVs marketed as HDR10 typically has a peak luminance of 1000-1500 nits and for this 10 bits is adequate. It is also worth noting that it is up to the TV vendors to decide how to handle luminances above the range that they can display, some will opt for a hard clip while others might opt for a more soft clip.
For reference, this is what an 8-bit quantization of Rec. 709 with a peak luminance of 100 nits looks like:
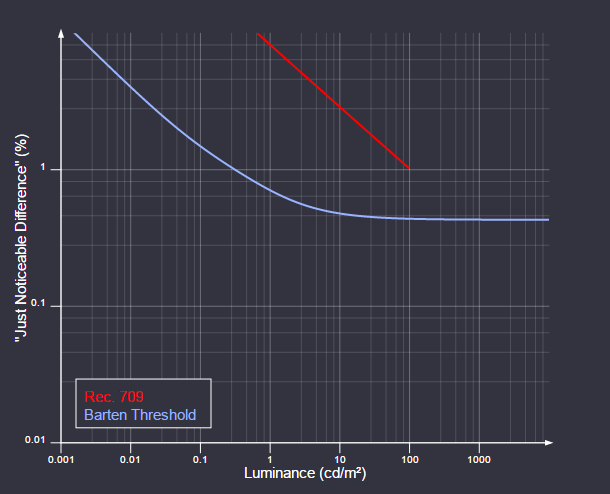
Rec. 709 EOTF (16-235)
As you can see we’re far above the Barten threshold and to make matters even worse consumers will likely have their TV adjusted to a considerably higher peak luminance than 100 nits (typically 250-400 nits) which will push the Rec. 709 curve even higher.
In closing
One of the biggest differences between Rec. 709 and HDR is that the luminance of the latter is specified in absolute terms. Theoretically this means that content mastered for HDR will look the same on all compliant TVs, at least up to their peak luminance.
There is a common misconception that HDR content will be overall brighter but generally speaking this is not true. HDR movie content will most often be mastered so that the average luminance (aka average picture level) is about the same as for Rec. 709 but with brighter and more detailed highlights and as a result somewhat darker midtones and shadows. In combination with the absolute nature of the HDR luminance this means that good viewing conditions are essential to get the most out of the HDR experience; in bright environments the pupil will be contracted and as a result details in the darker parts of the image can be hard to discern.
Read more about:
Featured BlogsAbout the Author(s)
You May Also Like