Daily news, dev blogs, and stories from Game Developer straight to your inbox
Sponsored By
When developing video games, satisfying the platform's memory requirements is one of the most challenging tasks. In this in-depth feature, veteran developer Jelle van der Beek offers a detailed analysis of his custom developed memory analysis tool created while working at Playlogic, focusing on monitoring memory use on the PC.
39 Min Read

It has been some years since I wrote two articles on memory usage. The series was called “monitoring your console’s memory usage” and was featured on Gamasutra. The articles discussed how I built a tool to monitor memory fragmentation, memory consumption and memory leaks. When I was almost done writing the articles I had an idea how to greatly improve the concept of the tool.
Shortly after, I started a new version of the tool and a few months later it was finished. Now, years after building the tool, the renewed concept still seems very strong and proved to be useful for the titles I have worked on. We even managed to locate memory leaks in the Xbox API and TechCertGame - the Xbox sample that serves as a sample for a fully technically certified game.
In this article I will discuss the concepts of the memory analysis tool that I developed during the time I was working at Playlogic. I surprisingly named it MemAnalyze 2.0 – I’m not particularly creative in thinking up catchy names.
We will start off with the concept, then we will see some of the features of the tool and finally we will dive into some of the tricky implementation details. The previous articles covered implementation details for Xbox and PS2. This time we are going to look at the pitfalls for monitoring memory on PC.
The MemAnalyze concept
We will quickly recapitulate the old concept. If you want to, you can read the details in the previous articles but it isn’t necessary to understand the remainders of this article.
We begin by intercepting all memory allocations in the game. For each allocation that is performed, metadata is saved in memory, most notably callstack information. At any moment in time the user can select to write all allocation data to file. The file serves as input for our MemAnalyze tool. The tool can analyse the data and offer multiple views on that data.
This concept has some drawbacks:
Monitoring memory usage is limited to a single moment in time, a snapshot of the memory statistics of the game.
Storing metadata in the application that is being monitored clutters your memory statistics. In my test environment, which is an average sized commercial game, the top of the allocation count is roughly half a million allocations. About 80.000 of those allocations were performed by operator new. The size of the metadata of an allocated block differs per block because of variable callstack lengths, but one of my tests shows that on average 126 bytes are needed per allocated block. Note that in this test 32 bit addresses were stored in the callstack. This means that approximately 77 megabytes of additional memory is needed for a memory map containing all metadata per block. If only the allocations from operator new were stored, we would need approximately 9.5 megabytes.
To remove both restrictions, we now instead send any allocation data directly over the network. A tool that runs on a PC then gathers the allocation mutations and maintains an internal memory map. This tool can then do real-time analysis on its internal memory map.
That’s actually all there is to it.
With the restrictions removed, we have the opportunity to perform real-time analysis. Now it will be possible to monitor your game’s memory behaviour in real-time. We can even record the history of the memory mutations. This makes it possible to spot something I like to call ‘logical memory leaks’.
This term will be explained later on in the article during the discussion of the recording view. And with memory restrictions removed, we can send over the entire callstack of an allocation – I was often forced to limit callstack information due to memory constraints. But be warned that the tool needs a good strategy to cope with all this data, especially during recording, as we are sending massive information over the network. To show what amount of data we are talking about, another test run is performed.
Just starting up the main menu in our game shows that already over 4 million packages have been sent - a package is any allocation, reallocation or free of a memory block. On average these packages have a size of 93 bytes. This means that when entering the main menu, almost 400 megabytes have already been sent to the tool.
The MemAnalyze features
This part will demonstrate the current features of MemAnalyze and how they help to solve memory problems.
Monitoring the current state
When the tool is started and a connection has been established, the tool will always simply track the current state. Figure 1 shows that there are some global statistics already in view. At any moment in time, we can click a button to perform any of the following forms of analysis:
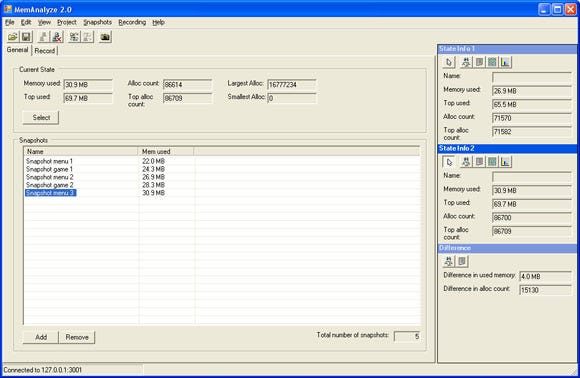
Figure 1: The main screen. On top some global memory statistics are displayed. To the right two memory state ‘slots’ are used to compare memory states. The remainder of the dialog is filled with a list to manage memory snapshots.
1) CallGraph analysis. This view displays the CallGraph. It resembles some of the ideas from the hierarchy view that was discussed in the previous articles. For each function, the amount of allocations, the total size and the percentage with respect to the game’s total allocation size are displayed. It is very easy to see the critical path in your memory consumption here. If you click anywhere in the CallGraph, source code with file and line information is displayed (see figure 2).
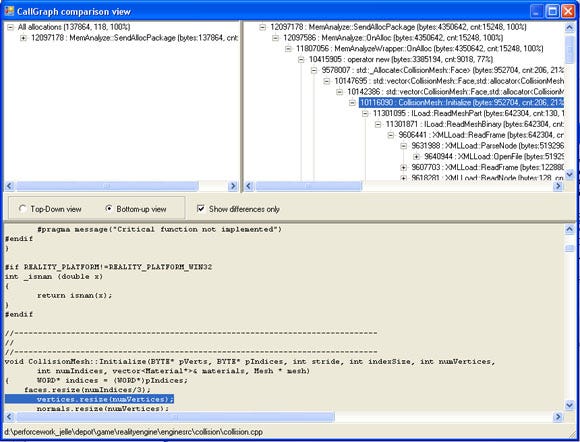
Figure 2: The CallGraph view.
2) TopX analysis. I named this one after the TopX view of the Xbox profiler. It displays all functions that directly or indirectly allocated memory along with their names, the allocation count, the total allocation size and the percentage relative to the game’s total allocation size. In this view you can sort on any of these types. When a function is clicked, source code is displayed (see figure 3).
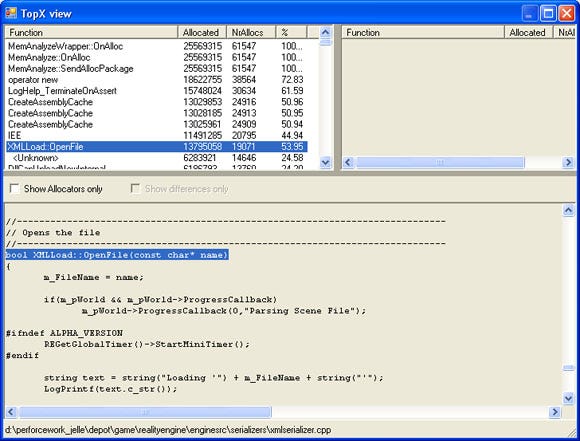
Figure 3: The TopX view.
3) Fragmentation analysis. This view displays the physical/virtual memory blocks as they are in memory. By clicking on any block, the callstack for that block is displayed. As for all views, source code is displayed when a function is clicked (see figure 4).
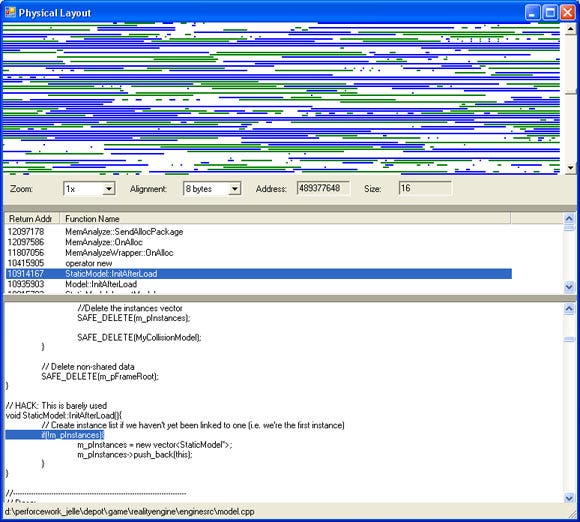
Figure 4: The Physical layout view.
4) Allocation overview. This view displays a graph of all of the allocations sorted either by size or by count. The horizontal axis displays the amount of bytes and the vertical axis displays either the allocation count or the total allocation size (see figure 5). This information can be very helpful if you want to write a custom memory manager. Custom memory managers can be written to optimise for a certain allocation size. For instance, have a look at the Boost memory pool implementation1, or have a look at how Windows XP and Windows Server 2003 use a Low Fragmentation Heap to avoid memory fragmentation2.
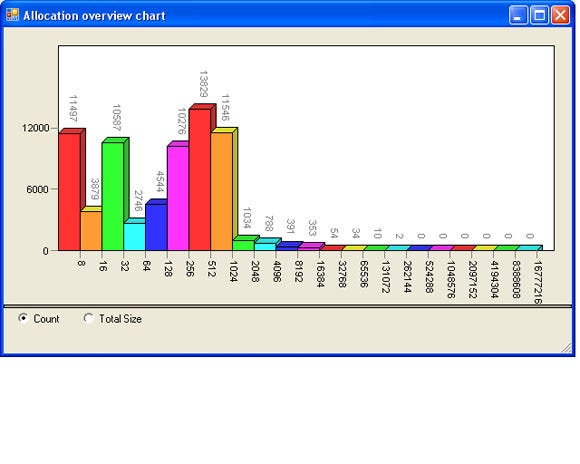
Figure 5: The allocation overview.
Making snapshots of the current state
At any moment while the tool is connected to your game, you can press a button to make a snapshot of the current memory state. This snapshot is stored in a list (see again figure 1). A snapshot can be analysed in exactly the same ways as the current state can be analysed.
Snapshots are particularly useful to find memory leaks. The CallGraph and TopX views that were discussed earlier can also be used to compare different states with each other. The views support dual-screen: the left screen displays the state from snapshot A and the right screen displays the state from snapshot B.
How does this help to track memory leaks? Well, the views can be ordered to view only the differences between those states (see again figure 2). If snapshots are created at moments in the game where the memory layout is expected to be equal, you can compare snapshots and see if snapshot B contains memory allocations that snapshot A does not have. If your game has a main menu, this may be a good point to compare snapshots in. The previous article discussed the algorithm for this comparison methodology.
Snapshots can also be controlled programmatically by the game. The game can order the tool to create a snapshot by using the MemAnalyze API. Some snapshots are more convenient to control from within the game. For instance, it may be helpful to create a snapshot right before the game is exited.
Recording the memory state
By recording the memory state we can see how the memory behaves over time (see figure 6). Because it is an actual recording we can also go back in time. We can put the cursor on any location in the history and perform the same four types of analysis as we could perform with the snapshots and the current state. While this is quite powerful already, we can also compare states within the recording in the same way we used to compare snapshots. You are probably not going to search for memory leaks in this view, but you can get some very interesting information out of this view. We use it for the following two types of analysis:
Runtime allocations. People having experience with console development will know that runtime allocations are best to be avoided. Allocations have performance overhead and may increase your memory fragmentation. They are easily spotted using the recording view.
Logical memory leaks. Let me try to explain what I call logical leaks. Imagine your game has an enemy and that enemy is not deleted during the game, but it is deleted properly at the end of your game because all enemies are, for instance, located in a global game object list that will be destroyed at the end of the game. Traditional memory managers cannot track these kinds of leaks easily as they will not report the objects as being still allocated after the game is finished. However, if you are playing the game for long enough, the memory usage grows and grows until you run out of it. These problems are hard to tackle - I am speaking from experience. This view will simply show you that the memory size is growing and you can see the culprit right away by, for instance, comparing two states from the recording in the CallGraph view.
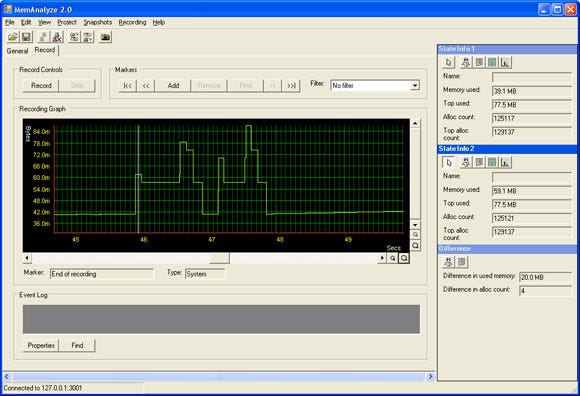
Figure 6: The recording view. This part was recorded while launching the game. At some point the figure shows hectic allocation behaviour, which turned out to be the loading of very large lightmaps. This is a good candidate for optimisation.
We can also send Markers to the tool by using the MemAnalyze API in a similar way as snapshots can be sent to the tool. Markers differ from snapshots by the fact that they do not store the current state – instead they are simply points in time that are being inserted into the recording view. When recording you can easily browse through the markers in your recording view. A use for markers can be to send a marker to the tool each frame. You can then see how memory behaves within markers – in this case, a single frame.
Implementation
The previous articles already covered a lot of implementation details for Ps2 and Xbox that mostly still apply to this version. The articles cover:
How to intercept all allocations.
How to retrieve callstack information.
How to read symbol information.
In this part we will revisit each of these subjects for PC. Some solutions may also apply to Xbox development, but they have only been tested on PC.
We will start off with a very powerful way to intercept all allocations. Then, an improved version of the StoreCallStack function from the previous articles is presented. Finally, we will again look at symbol loading - this time we are taking it a step further.
The tool is built with the .NET framework using C#. When applicable, C# details are presented.
Intercepting all allocations
In order to get a good view of your memory usage, we need to try to intercept as many allocations as possible. A good place to start is by overloading operator new and delete. While this does intercept all of the new and delete allocations in your game, this does not cover the allocations that are being performed by direct calls to malloc, LocalAlloc, GlobalAlloc or HeapAlloc. A large chunk of your game’s memory footprint may be performed by DirectX, which uses the lower-level functions to allocate its resources. As you may know, the PC does not support functions to easily intercept those lower-level allocations. Xbox has XbMemAlloc, which simplifies allocation tracking a great deal. On PC, it seems as if the best you can do to intercept allocations is to overload the new and delete operator.
But, there are actually ways of intercepting all of the allocations, but the solution is far from obvious. We can hook into the DLLs containing the low-level allocation functions. The great thing about this approach is that because all modules from the running process are using the DLL that is going to be patched into, literally all of the allocations of the running process are intercepted.
The methodology of hooking into DLLs is quite complex but thankfully there are people that have already encapsulated this functionality for us in a library. The first one is Detours, by Microsoft Research3. In order to get up and running quickly, take a look at the tracemem sample. This sample hooks into the HeapAlloc function. This library is free for non-commercial use.
A second solution is to use a library from Matt Conover4. At the moment of writing this library seems a bit more difficult to get started with, but there are two pros to this library: first of all it is free, even for commercial use, and second: Matt seemed to be very helpful in getting his software to run properly. If you want to get up and running with this library, look at the HeapHook sample included in the package.
Unfortunately, that is not all there is to it. We are treading dangerous grounds with this approach. We have to be very much aware that all of the allocations that are being performed will now pass through our allocation functions. That means that if a function that allocates memory from the heap is called during our heap callback, we may end up in an endless loop. This will surely be the case if you are using sockets. Sockets aside, you will be surprised how often allocations are being performed. You may suggest that doing a check for recursion in the heap callback easily prevents this. This is true, but let’s take a look at an even more dangerous scenario.
Imagine that some thread is using sockets – probably as a result of an asynchronous operation - and right in the middle of that socket operation, an allocation is performed. Our allocation function will be called and our own socket operation will be started. This generally horribly messes up the internal state of the socket library. Checking for recursion in the callback function won’t help you this time, so we need another solution to this problem.
Too illustrate that we are indeed treading dangerous grounds, I would like to share what happened with my first attempt to solve this problem. My idea was to check what kind of module called the allocation function. If it were one of the socket DLLs, no socket operations would be performed. While I wasn’t all too thrilled about this solution, it also didn’t seem to work. I tried to match the return address in our callback to the address ranges of the socket process. In very specific cases when I used the DbgHelp library to obtain information about the socket process, the application crashed. It turned out that during the loading of DLLs, allocations were being performed. DbgHelp did not appreciate us retrieving information about processes during the loading of a new process, so I had to search for another solution.
The one thing that solves our problems is fortunately relatively simple: we need to use a worker thread for our communication with the tool. When allocations are performed, our metadata is collected and stored into a buffer, and our worker thread is kicked. The worker thread will send the data to the client. This will always break any form of recursion. This makes it even possible to monitor the allocations that are being performed by our own sockets, if desired.
We are close now but there is one more thing to watch out for. It may be possible that deadlocks occur due to the chain of events that are displayed in figure 7. This situation can be avoided by using double buffering, and by protecting the double buffering logic with critical sections – but just the double buffering logic. The allocation callback should never need to wait for the send operation to complete. The downside to this approach is that the databuffer needs to be large enough to contain data of a series of allocation events. On the positive side, this form of batching may speed up the send process.
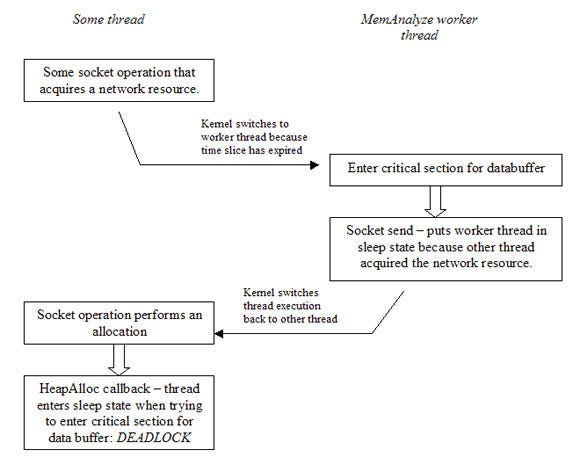
Figure 7: The chain of events that may cause a deadlock situation.
As you may understand by now, this methodology may not be for the faint hearted. It may be good to start with overloading operator new and delete. For best understanding how to overload new and delete properly, I would advice to read chapter 8 from Scott Meyer’s Effective C++ 10.
Improved callstack tracing for PC
The previous article contains solutions to callstack tracing for several platforms. However, there is one important thing to improve on the PC routine that was presented. The PC version contained a low-level implementation that worked fine in itself, but had one major drawback: it was required that all of the modules had the compiler optimisation setting ‘omit frame pointers’ disabled. While you can do that for the projects you control yourself, you often cannot do that for third party projects. Often that limitation caused crashes with that version of the StoreCallStack routine because the stackframe was pointing to unknown memory.
This version from listing 1 uses the StackWalk64 function from the DbgHelp library, which is part of the Windows platform SDK.
I would also like to point to a sample made by Jochen Kalmbach 5, which is much more extensive then the sample listed in listing 1. Point needs to be taken that the algorithm used by StackWalk64 is much slower than the StoreCallstack function that was presented in the previous articles. As a thread from the Microsoft forums suggest 11, the stackwalk function from the DIA SDK may be faster than this stackwalk function from the DbgHelp library. This may be something to look into.
unsigned int StoreCallStack( | ||
Listing 1: The new StoreCallStack function for x86. |
Symbol loading
Before continuing, let’s recapitulate quickly on function addresses. When retrieving callstack information, you always retrieve a list of absolute function addresses – the addresses of the functions as they are present in memory at that moment in time. An image, for instance, an executable or DLL, may be loaded on a different location in memory each time the application is started. The image’s location in memory is called the image base.
By subtracting the image base address from the function’s absolute address, we obtain the function’s address relative to the image base. This is often called the Relative Virtual Address (RVA). The RVA can be used to retrieve symbol information from, for instance, a program database (PDB).
When DLLs are used, it gets more complicated. The callstack may contain addresses that cross DLL boundaries. This has quite a few consequences, as I will demonstrate.
For starters, it is not possible to send RVAs out to the tool. Doing so anyway may cause conflicts with other relative addresses. Think about it: two distinct functions in different DLLs having different absolute addresses may have the same relative addresses. That breaks both the analysis algorithms in the tool and the symbol lookup.
So, we need to send over absolute addresses, at least for platforms where multiple modules are used. What follows is that somehow the tool needs to know what images are loaded and what the base addresses of those images are. That information will be used to load symbol information. We will now discuss two solutions to this problem.
Solution 1: Loading symbol information through SymInitialize.
On PC we load symbol information using the DbgHelp library. In our first solution we use the SymInitialize function from the DbgHelp library:
BOOL SymInitialize(
HANDLE hProcess,
PCTSTR UserSearchPath,
BOOL fInvadeProcess
);
The first parameter is a handle to a process. If you pass a valid handle to a process, SymInitialize will enumerate all of the loaded modules for that process and search for the symbol files. It will search for the symbol files in their default locations. Additional searching can be being performed using UserSearchPath, the second parameter.
There are some pros and cons to this approach:
Pros:
It is very convenient and powerful: it finds the symbol information itself for all loaded modules.
It knows what image base addresses to load the symbol information at.
Cons:
The tool can only use this if the game is running locally – i.e. not over the network.
The tool can only use this as long as the game is running. If we decide to save our ‘project’ for offline analysis, the process is no longer alive.
If the drawbacks prove not be a problem for you, possibly when your tool serves as a debugger for a running process, I would suggest using this method to load symbol information. Listing 2 displays a sample program that demonstrates how this works.
#include "stdafx.h" | ||
Listing 2: The SomeDummyProcess program. |
Let’s go over this code. Our application is a very simple win32 console application that outputs the current running process Id and it outputs an address in the range of the function Foo. Because you cannot read the instruction pointer (EIP) directly, I used a trick from Dan Moulding to obtain the instruction pointer by using the return address. You can read his article at 6. Another way to do this is to use the ReturnAddress intrinsic, which is Microsoft specific, but will also work at architectures other than x86.
After printing, the program goes into sleep state to avoid the process from exiting.
The program output shows the current process Id and the function address of Foo:
process id: 0xe9c
Function address: 0x411553
Listing 3 shows the program that is going to use the process Id and the function address.
#include "stdafx.h" | ||
Listing 3: The FindFunctionInProcess program. |
This program takes two parameters: the process Id and the function’s absolute address. If you have the other program still running, you can run the program from listing 3 with the parameters as the first program has printed them. You can see how OpenProcess is used to obtain the process handle.
This handle needs to be passed to all of the DebugHlp functions. Note specifically how SymInitialize is called: the fInvadeProcess parameter is set to TRUE. This makes sure that all modules within a process have their debug information loaded. For debugging purposes the function GetModuleFileNameEx function is used to print the filename of the executing process.
To compile and run both program listings, create a win32 console project, paste these pieces of code into each main.cpp, and adjust the link settings so that DebugHlp.lib and psapi.lib are linked with them. The latter is for linking GetModuleFileNameEx. The code was tested using Visual Studio 2005.
Note: before running, make sure you have the latest version of DbgHelp.dll. DbgHelp.dll is contained in the Debugging Tools for Windows 7.
The following program output shows that the Id correctly matches the process’s filename and that the function address indeed has been resolved to the function name Foo:
Process refers to: f:\work\tests\somedummyprocess\debug\somedummyprocess.exe
Function name: Foo
As you can see from this sample, we need the process Id to obtain the process handle. That process handle is used to load symbol information. The next question to answer is: how does the tool obtain the process Id? Surely we can let the game send over the process Id by calling GetCurrentProcessId and transmit it to the tool.
This works fine but it does introduce a very platform specific implementation in the networking part, which may not be desirable. We can also let the tool enumerate all the running processes, display a dialog box with the running processes, and let the user select the process to obtain symbol information from. Maybe you recognize this strategy from the way Visual Studio is capable of attaching to a process for debugging. This solution is obviously also a platform specific solution, but no matter which way we go about it, symbol loading in the tool is going to be platform specific anyway. Let’s see how this can be done.
Process handling is done through the PSAPI library, which is the Process Status Helper API. PSAPI is also part of the Windows Platform SDK. We already used the function GetModuleFileNameEx from this library in listing 3. The next listing, listing 4, demonstrates how to enumerate the processes and how to obtain the process handles.
#include "stdafx.h" | ||
Listing 4: The EnumerateProcesses program. |
The program output shows a list of the active processes along with their Id:
SMSS.EXE (Process Id: 0x21c)
WINLOGON.EXE (Process Id: 0x278)
SERVICES.EXE (Process Id: 0x2a4)
LSASS.EXE (Process Id: 0x2b0)
ATI2EVXX.EXE (Process Id: 0x340)
SVCHOST.EXE (Process Id: 0x360)
SVCHOST.EXE (Process Id: 0x3ec)
ATI2EVXX.EXE (Process Id: 0x478)
CLI.EXE (Process Id: 0x9d4)
CLI.EXE (Process Id: 0xf8c)
NSCSRVCE.EXE (Process Id: 0x974)
VCExpress.exe (Process Id: 0x950)
dexplore.exe (Process Id: 0xca4)
mspdbsrv.exe (Process Id: 0xf0)
WINWORD.EXE (Process Id: 0xf18)
msmsgs.exe (Process Id: 0x65c)
EnumerateProcesses.exe (Process Id: 0x118)
Solution 2: Loading symbol information using EnumerateModules64 and SymLoadModule64.
Until know, we discussed how to load symbols using SymInitialize. As stated earlier, this method can actually only be used if you are debugging a local process. Next we will discuss a solution without this limitation.
We can also let the tool request information about the loaded modules from the game when symbol information is required. Console platforms with only a single loaded image can simply return the image base and image name. Other platforms having multiple loaded images can return a list of loaded modules, along with their image bases. What we need to do now is mimic the behaviour of SymInitialize. We can enumerate all loaded modules for a process by using EnumerateModules64. Using this function, we can find the image bases for all of the loaded modules, their names and even the location of the PDB file. Listing 5 shows exactly that:
The program output shows the information that we retrieved from the active modules:
This information can be sent to the tool. Note that this way of requesting image information by the tool does require the network connection to support two-way traffic.
Now that we have the names of our program databases we can load them using SymLoadModule64. The previous article contains a code snippet that loads information using SymLoadModule64.
#include "stdafx.h" | ||
Listing 5: EnumerateModuleInfo program. |
name: D:\work\Tests\DisplayLoadedModules\debug\DisplayLoadededModules.exe
base: 4194304
size: 118784
symbol type: PDB symbols.
pdb: .\DisplayLoadedModules.pdb
name: C:\WINDOWS\system32\ntdll.dll
base: 2089811968
size: 745472
symbol type: Symbols generated from a DLL export table.
pdb:
name: C:\WINDOWS\system32\kernel32.dll
base: 2088763392
size: 1040384
symbol type: Symbols generated from a DLL export table.
pdb:
name: D:\work\Tests\DisplayLoadedModules\debug\dbghelp.dll
base: 50331648
size: 1134592
symbol type: Symbols generated from a DLL export table.
pdb:
Note: I wasn’t kidding about downloading the latest version of DbgHelp.dll. I have wasted a lot of time on the bugs from older DbgHelp.dlls. Listing 5 contains a call to SymGetModuleInfo64 and that function simply always returned zero on the 5.1 version of the DLL. Error handling is bad in this library. In the latest version of the DLL, which is 6.6 at the time of writing, there is no way I can get the function SymGetSymbolFile to work. So, I advice you to pay attention when programming for the DbgHelp library, and don’t forget to use the latest DLL.
Moving to C#
The samples we have seen so far have all been written in C++. The tool is written in C#, so here are a few pointers to get up and running with the sample code in C#.
First, it is important to note that the .NET framework has powerful support for processes. The Process class contains supports for both local and remote processes but I doubt whether handles to remote processes can be used in conjunction with the handles that have to be passed onto DbgHelp. This may be something to look into.
The code from listing 4, the EnumerateModules program, can be written in just a few lines of code in C#, as listing 6 demonstrates.
The remainders of the listings can be ported to C# relatively easy. There is just one tricky part, and that is calling functions to the various DLLs like DbgHelp.dll from C#. The .NET framework uses a system called platform invokes, often called p/invokes. A thorough discussion of this subject is beyond the scope of this document but the next listing will give you a head start. You need to import the functions into your C# code. Listing 7 demonstrates how to do this for most of the functions that we have used throughout the samples. Put these in your C# code and you will have little problems porting the C++ code to C#.
Process[] localProcesses = Process.GetProcesses(); | ||
Listing 6: Enumerating the processes in C#.
|
public class DbgHelp | ||
Listing 7: p/invoke signatures for some DbgHelp functions. |
To read more about this subject, refer to8. One subpage from that reference that is particularly useful is the page about the type mappings from .NET to native Windows types9. If you know the type mappings it is generally not too difficult to come up with new signatures for p/invokes. As a last tip: www.pinvoke.net has a database of p/invoke signatures and there’s even a Visual Studio add-in that is connected to the database. Unfortunately the database does not contain any DbgHelp.dll functions at the time of writing.
What’s next?
There are still enough ideas on how to make the tool much more powerful. For instance, the fragmentation view is somewhat weak at this moment. Currently it is only possible to view the physical locations of the memory allocations of a certain moment in time.
It would be great to see an animated playback of the recording of the physical locations of the blocks. If you could playback that view at various speeds, I think it would be much easier to see what parts of your program are responsible for most of the fragmentation. The fragmentation could also display more statistics like the largest free memory block, which is essential information for a fragmentation view.
Conclusion
We have seen that intercepting allocations at a very low level can certainly be done for PC and we know it can also be done, at least to a very reasonable extent, for the Xbox and Xbox 360. For some other platforms it is sometimes hard or even impossible to track certain allocations, like the loading of the executable images, the allocations that are being performed by third parties or the allocations that are being performed by the kernel.
Besides the fact that we could really use help from the platform manufacturers to intercept allocations easier, I also feel that tools like MemAnalyze should be part of every standard SDK that comes with the development kits. Imagine that you would be able to launch any game in a special debug mode and that a tool like MemAnalyze would capture all of the allocation behaviour. The game programmer would not need to perform any additional work.
An attempt like this has already been made for Xbox using XbMemDump. Too bad Microsoft did not put some more work in XbMemDump. If they would have put in some extra effort it could have been really useful. In my opinion they were looking in the right direction.
In the future the amount of memory that is available for games will increase. This does not mean that we can loosen up on memory management. In fact, I state the exact opposite: with more memory available the amount of content will increase, so it is becoming more important to be able to manage that memory properly. So I hereby call upon platform manufacturers to start writing better tools and APIs to attack memory related problems in console games.
Until a good alternative shows up, we will just continue building solutions ourselves - which is fortunately a fun thing to do. I think I will build a new version of MemAnalyze with the new ideas in mind. I have to get going with the Windows Presentation Foundation anyway.
Acknowledgements
I would like to thank the people at Playlogic Game Factory, Tom van Dijck, Harm van Dinter and Arjan Janssen for their contributions they have made over the years.
References
1 Boost pool implementation:
http://www.boost.org/libs/pool/doc/index.html
2 Windows’ Low Fragmentation Heap
http://msdn2.microsoft.com/en-us/library/aa366750.aspx
3 Detours, a library by Microsoft Research to detour DLL functions:
http://research.microsoft.com/sn/detours/
4 Matt Conover’s solution to DLL hooking:
5 Jochen Kalmbach’s StackWalker:
http://www.codeproject.com/threads/StackWalker.asp
6 Dan Mouldin’s trick to obtain the instruction pointer:
www.thecodeproject.com/tools/visualleakdetector.asp
7 The latest Debugging kit for Windows:
http://www.microsoft.com/whdc/devtools/debugging/default.mspx
8 Marshalling data with platform invoke:
http://msdn2.microsoft.com/en-us/library/aa720284(VS.71).aspx
9 Platform invoke data types:
http://msdn2.microsoft.com/en-us/library/aa720411(vs.71).aspx
10 Scott Meyer’s Effective C++, third edition. Published by Addison-Wesley, ISBN: 0-321-33487-6.
11 Discussion on MSDN forums about StackWalk64 performance:
http://forums.microsoft.com/MSDN/ShowPost.aspx?PostID=396838&SiteID=1
Read more about:
FeaturesAbout the Author(s)
You May Also Like