Daily news, dev blogs, and stories from Game Developer straight to your inbox
Sponsored By
Featured Blog | This community-written post highlights the best of what the game industry has to offer. Read more like it on the Game Developer Blogs.
5 billion hours of play. 6 million players. 3000 games on Steam. 1 distribution model that explains how time spent playing games on Steam rises and falls – as a function of time.
12 Min Read

5 billion hours of play. 6 million players. 3000 games on Steam. 1 distribution model that explains how time spent playing games on Steam rises and falls – as a function of time. This has powerful implications: if playtime follows a specific distribution, we can predict it.
This post was written by Anders Drachen, Rafet Sifa and Christian Bauckhage.
Looking at large-scale behavioral datasets from games can sometimes be a bit awe-inspiring. Knowing that a specific player spent thousands of hours on a game, or that another game is played hundreds or thousands of years every day by the community, is a humbling reminder of how much time is put into this activity on a global scale.
The remarkable amounts of time we spend playing games are immediately evident when looking at Steam. Thanks to Valve´s decision to make Steam player profiles public (unless the user decides to have a private profile), and also to begin tracking time spent playing different games for players around March 2009, it is possible to access playtime data across the 172 million accounts on the platform, , with 3-7 million concurrent users, across thousands of games.
We recently harvested data from 6 million public player profiles on Steam, collecting information about which games people owned, played, and how much time was spent playing the different games. This corresponds to about 3.5% of all Steam profiles, or about 8% if related to the active accounts.
In this post – and the ones that will follow - our main goal is to dig deeper into the underlying behaviors that we can get insights into via employing machine learning methods on these types of datasets.
To begin with, we report on an investigation of playtime patterns, which shows that the amount of time Steam players have put into more than 3000 different games can be modelled using one distribution model.
This suggests that there are fundamental properties governing playtime as it evolves over time, irrespective of the games properties as such, which we here – somewhat boldly and risking horrible hubris - refer to as the Playtime Principle. This has direct implications for our ability to predict playtime.
Steam data
The dataset we are using here covers in total more than 3200 applications and games, of which a bit over 3000 are full games – i.e. not demos or non-game software. One of the things that surprised us when evaluating the basic descriptive features of the dataset was the amount of playtime recorded: over 5 billion hours, or roughly 580,000 years of play. That is about 830 hours per player (34 days) – on average in a highly skewed distribution (we rechecked this a couple of times to be sure).
This may sound like a high number, but there are actually records of similar in the past. For example, Ars Technica, in their recent excellent series reporting statistics from a 250,000 sample of Steam public profiles, estimated, based on their sample, a combined estimated total of 3.8 billion hours played for Dota2 players on Steam. Apparently, Dota2 players put around 1140 years of playtime into the game every day (that is 3.6 billion hours over the course of a year). Similarly, Wargaming.net reported 3.3 billion hours of playtime for the World of Tanks for 2013 alone (in the course of play which they reportedly wrecked 22 billion vehicles). Game analytics has most definitely entered the domain of big data.
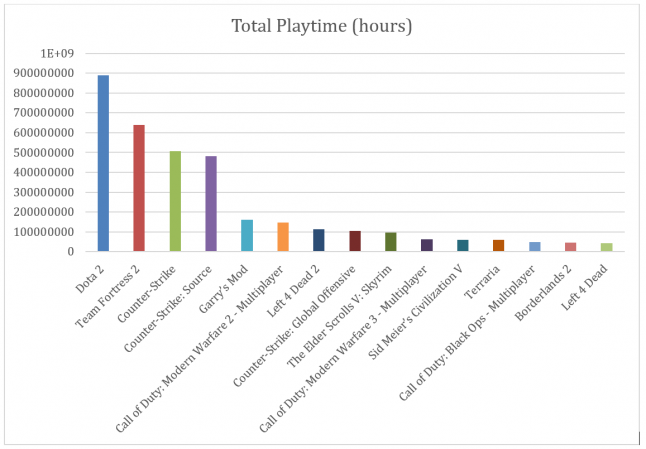
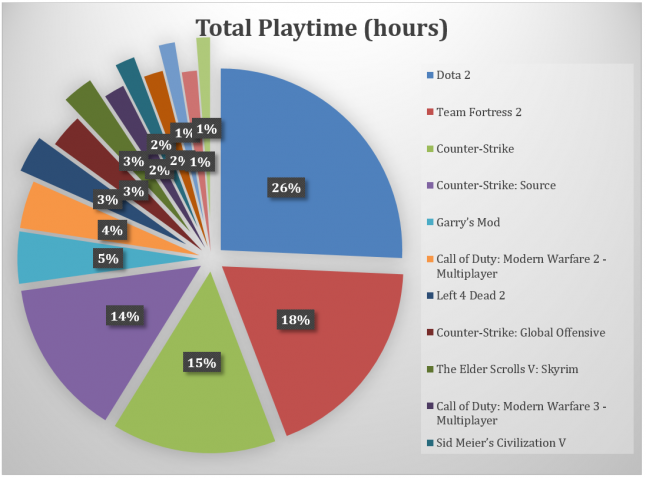
As mentioned, Ars Technica recently reported descriptive statistics from their own investigation of the Steam profile network, called Steam Gauge, showcasing how harvesting publicly available information can provide interesting information about sales and gameplay hours for this the biggest PC gaming platform. At the time of writing there are three posts on Steam Gauge, all well worth a read. In our dataset, we can make similar conclusions about the skewed distribution of the amount of time Steam users put into different games. Dota 2 wins hands down with almost 900 million logged hours of play among the 6 million players in the dataset, followed by Team Fortress 2 with almost 640 million hours, and CounterStrike with a bit over half a billion hours of recorded playtime.
The Playtime Principle
We can derive a number of conclusions from the work we have done on the Steam data so far, but the one we will focus on here is that playtime as a function of time, across thousands of games on Steam, can be observed to follow the same frequency distribution.
What we are seeing here is potentially a fundamental law of gameplay: a rule specifying that player interest will rise and decay following this specific distribution model, called the Weibull distribution.
There is a mathematical argument that can be made which shows how the Weibull distribution algorithm can be rewritten to show how it couples two antagonistic growth processes. One with the propensity to grow, the other to decline. The latter eventually becomes so large to cancel the former out. We explain this in more detail here.
This is why we think the Weibull captures human psychology so well in this case. For example, it would be reasonable to assume that on any given day, player’s eagerness to play a game will depend on a variety of different factors, but, at the end, most certainly reach a zero (as everyone eventually stops playing the game in question).
This has powerful implications. Primarily, if playtime follows a specific model, we can predict playtime.
In essence, what our analysis shows is that if we collect very early playtime data, we can fit a Weibull distribution to these, and accurately predict what the playtime frequency distribution will look like for that game.
There have been some examples of the Weibull being fitted to gameplay data in the past, which adds further evidence to this result – we will talk more about these below.
An important caveat is that Steam does not support mobile games, alternate reality games and any of a myriad game forms out there. We therefore do not know if the Weibull is a good model fit for playtime patterns in these games. However, we eagerly look forward to hearing from the community if the Playtime Principle holds across different types of games.
Supporting evidence
Something that gives us confidence in the Weibull distribution serving as a good model for playtime – apart from finding it does so across 3000+ games - is that the model has cropped up in presentations, paper and reports in connection with games several times within the past few years.
There have been hints of the playtime principle in the game analytics, web science and network science environment recently, e.g. documented power laws in various individual games, and in some research papers in networking and elsewhere.
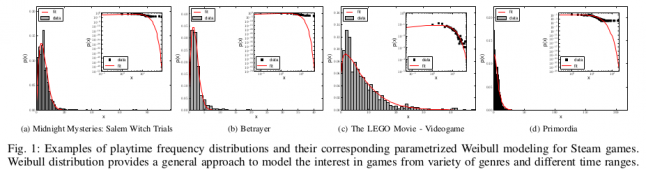
Two years ago, we investigated playtime frequency distributions across 5 AAA games and about 250,000 players, discovering that random process models fit the data very well. Random process models are very commonly used to describe events that occur in nature, e.g. fluctuations in financial markets. Specifically, the Weibull distribution worked very well across these five games we investigated.
To explain this in terms of interest, we could loosely say that this means that on average, a player feels the urge to play a game at constant rate, and that this rate is a function of time. The models function as a Power Law process, specifying that the rate at which an average player feels the urge to play, will decrease over time, as described by the two growth processes of the Weibull distribution.
For each game we also noticed that graphs were highly skewed to the right – which means that for each game there were a high number of people that played the games for only a few hours (see the figure above).
Earlier than that, on the academic side, Pittmann and GauthierDickey investigated the distribution of players in World of Warcraft and Warhammer online, and fit session length data to a Weibull distribution. They reported similar good fits of doing so as Chris Chambers and his colleagues did for CounterStrike, all the way back in 2005. Also using session times (rather than raw playtime as we do here), Feng and his colleagues reported that the distribution of the number of play sessions a person plays before quitting Eve Online fits a Weibull distribution. This means that most players do not stay long in the game, but that the distribution has a long tail with a small fraction of people that play for a very long time.
In the industry, Nick Lim reported on an analysis of freemium games that player behavior is better approximated as a power law than a normal distribution. More recently, Dmitry Nozhnin addressed prediction and retention on Gamasutra.
These are just examples of the reports that have come out in recent years on attempts in academia and industry to identify high-level patterns of behavior in and across games.
Limitations and caveats
There are a number of potential sources of noise or bias in the playtime data we can obtain from the Steam public profiles. Furthermore, it is important to note that it is not directly possible to generate a perfect random sample of the Steam profiles.
To quickly summarize, these include:
Valve did not implement the playtime tracking feature until March 2009. Games played before that time will therefore not have all playtime recorded, which means that for these games, the playtime totals will be smaller than they actually are.
It looks like Steam does not record playtime if the game in question is not active, for example if the game is running in offline mode or is paused. Also, if the game is launched outside the Steam portal playtime will not be recorded.
We have seen reports of issues with discrepancies between the playtime user believe they have spent on a game and the numbers provided by their Steam profile. There can be different reasons for this, including multiple versions of the same game, platform differences etc.
Steam users can select to have their profiles be private, which means that their data cannot be obtained outside of Valve. According to Ars Technica, they encountered about 6% of Steam profiles being private during their data collection. This does not impact directly on the results we are presenting here, but can impact generalizability of the conclusions if there are differences in the playtime distributions between public and private Steam users.
We harvested the data during the Spring 2014, and did not distinguish based on the age of the Steam account. What this means is that the dataset contains complete play histories for some players, but incomplete histories for others (i.e. those that are still playing). This can add a bias towards making playtime durations for specific games appear shorter than they actually are.
We removed games with a total playtime of less than 3 hour bins, for the purpose of the playtime analysis only (not for any of the descriptive numbers). Given the 1 hour duration of each time bin, 3 hours of gameplay is necessary to fit the Weibull distribution to the playtime histograms. The same analysis can in principle be applied to the same number of time bins, but with the time bins being of shorter duration.
It is important to note that Steam does not show any games on the profile of players unless the game is actually downloaded and installed (and possibly also played once).
In this investigation we do not multiply the different numbers to estimate e.g. the total amount of hours played across the Steam community, but stay within the confines of our 6 million player sample. However, it is worth noting that Ars Technica did this for their reported 250,000+ player sample, and reported more accurate sales estimates when multiplying results to the full 172 million current Steam users, rather than only 75 million active profiles. It is not known to us how Valve defines an active user.
More Steam results
We will be writing more about the Steam dataset in the near future, and report on an ongoing basis as we employ different machine learning techniques dissect the dataset and the underlying behaviors.
A more comprehensive description of the analysis process, which includes the details of the math involved, behind the Playtime Principle will be published in the proceedings of the Computational Intelligence in Games conference later in 2014.
If you are curious to know more about what we are doing right now, feel free to contact us on @andersdrachen.
This post also appears on andersdrachen.com
Read more about:
Featured BlogsAbout the Author(s)
You May Also Like