Trending
Opinion: How will Project 2025 impact game developers?
The Heritage Foundation's manifesto for the possible next administration could do great harm to many, including large portions of the game development community.
Gamasutra analyst Matt Matthews breaks down U.S. retail video game sales for the month of October, as reported by the NPD Group, and additionally touches on global sales of third-party publishers.

When the sales-tracking NPD Group reported its estimates of U.S. retail video game sales for October 2011, the figures revealed a second straight month of software revenue growth. While October and November did show back-to-back software revenue growth in 2010, the last time the industry saw successive months of software growth was in January and February 2009.
Going by revenue and unit sales, that pair of months back in 2009 marked the very peak of the retail video game industry in the United States. From March 2008 to February 2009 the industry recorded a record $21.7 billion in sales, including a record $11.1 billion from software alone.
Given the slate of software available in November, the stage is set for a third month of growth and possibly a turning point in the industry's fortunes. We'll look into that argument more closely.
Next, we will examine Nintendo's fortunes, both in the U.S. and globally, and try to get an idea of how the company will fare between now and when the Wii U launches in 2012.
For the first time in this column we expand our horizons beyond just the results reported by the NPD Group about the United States market. Combining data from five major third party publishers in the industry – Activision Blizzard, Electronic Arts, Take Two, THQ, and Ubisoft – we will present a snapshot of the industry as of the end of September 2011 compared to the same measures a year earlier.
Among the questions we will address: How fast are digital sales increasing, and how quickly is retail decreasing? How much of the market does digital account for? Which platforms are seeing growth, and by how much? How much does North America really count for in the global video game market, and how is its share changing relative to the other territories?
The big story for October was clearly the growth in software sales, a segment that suffered greatly during the middle of this year. Recall that four months, from May through August, sales fell to low levels that the industry hasn't seen in many years.
Total unit sales during that period were under 42 million units across all consoles and handhelds. The average price of the software sold at retail during that period was only $35. In the data we have – going back to 2007 – we only found a single month in which the average price of software approached $35 and found no earlier four-month period in which unit sales were lower than 46 million units.
With the launch of Madden NFL 12 from Electronic Arts in late August (included with the September data due to NPD's retail calendar), consumers appear to have begun opening their wallets again. The average price that month rebounded to over $43 per game, and unit sales jumped by nearly 40 percent on a per-week basis.
Expectations going into October were quite high, and most analysts expect an amazing finish to an otherwise lackluster year. Michael Pachter of Wedbush Securities expected revenue to grow by 14 percent while Cowen & Company's Doug Creutz favored a more optimistic 21 percent. The final figure was a much more modest 2.7 percent.
At the very least, consumers can't object to the big-name titles being offered to them – although they might object to the prices. The list of top releases for October is remarkable in itself: Battlefield 3, Rage, Just Dance 3, Forza Motorsport 4, Batman: Arkham City, and NBA 2K12. All of those titles made the all-format chart that the NPD Group released for October 2011, along with hardcore-favorite Dark Souls.
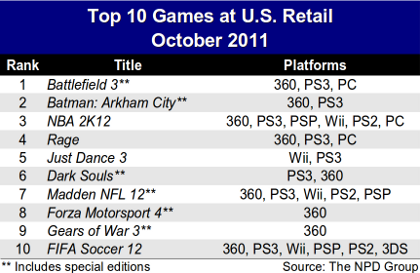
NPD Group analyst Anita Frazier noted in her comments to the press that if the chart were extended one more slot then Activision Blizzard's Skylanders: Spyro's Adventures would have taken that 11th position.
The actual figures behind the software for October are quite robust: average prices rose to over $45 and unit sales on a weekly basis grew nearly 18 percent from September. In terms of total unit sales, we believe this is the second-strongest October in history, lagging the October 2008 record by at least a million.
With momentum from October, it is likely that November will be another record month. Again there is a slate of high-profile titles like Call of Duty: Modern Warfare 3, Uncharted 3: Drake's Deception, The Elder Scrolls V: Skyrim, Assassin's Creed Revelations, Need for Speed: The Run, and Saint's Row: The Third. Moreover, Nintendo's 3DS will get what many expect to be its first evergreen title, Super Mario 3D Land.
All of those launches come at the very time when many retailers are priming consumers with competitive discounts on games and systems in general, and also preparing for blowouts on Black Friday, the Friday following the Thanksgiving holiday in the United States known for being the biggest shopping day of the year.
To show a month of year-over-year growth in unit sales, the industry will have to sell approximately 34 million units of software during November, at physical retail. At that level prices must remain above $43 per unit to show growth in revenue. Those are stiff requirements, but the October results suggest that there is pent-up demand and that American consumers – urged on by retail promotions and alluring new games – will rise to the challenge.
In the hardware segment, total revenue was up with the Xbox 360 leading the industry at 393,000 systems for the month. Nintendo's Wii and 3DS and Sony's PlayStation 3 had sales of around 250,000 units for the month while the Nintendo DS fell to around 180,000 units. For the DS, that's the weakest October showing since October 2005, the 12th month of its first full year on the American market.
The hardware segment also showed its second monthly year-over-year increase in unit sales, the only other such month coming in April.
Finally, we note that the accessory segment has now had six straight months of year-over-year declines. Starting around the end of 2009 – far removed from the launch of Microsoft's Kinect and Sony's Move – the accessory segment began a growth spurt that finally ended in March of this year. Regrettably, the accessory segment is the most opaque to us, as the NPD Group provides very little in the way of additional data, and so we cannot even begin to speculate with what drove that long 17 months of growth and what then changed in March to bring on the contraction of accessory sales. Anita Frazier of the NPD Group did remark that “the accessory types that declined the most were Gamepads and Specialty Controllers.”
Below are the current monthly and year-to-date revenue figures showing where the industry stands.
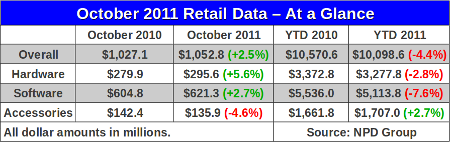
The NPD Group highlights to the media that the data above represent retail revenue figures, and that there are separate estimates for video game content sold through other means. They are providing quarterly estimates of those extra-retail sales, including mobile games, downloadable content, and casual games, along with other segments. Our latest analysis of the full market figures released by the NPD Group was given in last month's article.
For historical perspective on where the industry stands relative to the past six years of retail video game sales, the following graph shows annual revenue from 2005 to the present, subdivided by monthly revenue segments.
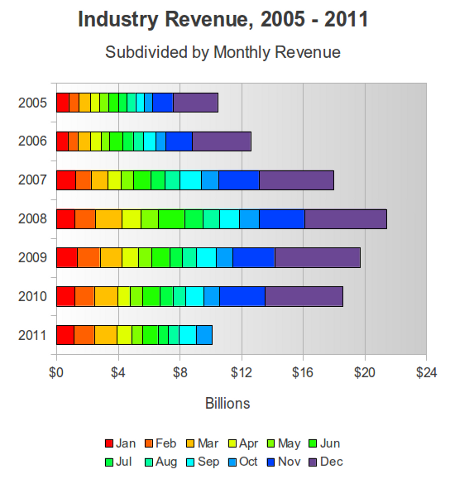
In terms of total retail revenue, the U.S. video game industry is precisely $400 million behind the same point in 2007. However, it should be noted that 2007 included a so-called leap week in January, so the revenue figures are slightly different. To be precise, at this point in 2007 the industry had recorded $10.5 billion in revenue over 44 weeks while in 2011 the industry has recorded $10.1 billion over 43 weeks.
In January 2009, Nintendo claimed that it was responsible for 99 percent of the growth in the U.S. retail video game market in 2008. Those were halcyon days, indeed, for the fortunes have shifted and Nintendo is no longer contributing to the growth – it is leading the contraction.
For example, software revenue has seen a year-over-year decline from 2010 to 2011. According to our estimates, based on analyst comments, Nintendo is the leading contributor to that loss. For the first three quarters of 2011, Nintendo saw its software revenue in the United States decline by over a quarter of a billion dollars. In the same period, the retail market for console and handheld software declined by over $420 million. That means Nintendo contributed approximately 2/3 of the decline in the retail software market from January through September 2011.
For the sake of comparison, Microsoft's software revenue was essentially flat while Sony's PS2 and PSP contributed to the rest of the decline in software sales.
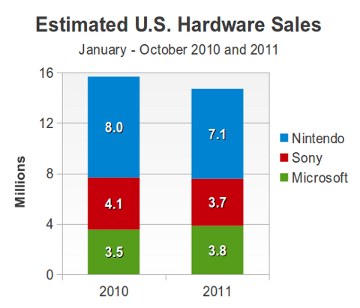
Through the end of October, according to our estimates (based on NPD Group figures and public statements made by Nintendo, Microsoft, and Sony) Nintendo saw its U.S. hardware unit sales decline by nearly 875,000 units compared to the same point last year. Across the entire U.S. hardware market, unit sales are down around 970,000 units, so – by the same logic applied to market growth in 2009 – Nintendo's platforms contributed 90 percent of the decline in hardware sales for this year.
Truly, the picture is far more nuanced than that – as it was two and a half years ago. This year Sony has seen its year-to-date (YTD) hardware sales decline by around 400,000 units, a relative rate of decline on par with what Nintendo has seen contemporaneously, while Microsoft has seen a nearly 9 percent increase in YTD hardware sales.
It's simply a fact that Nintendo saw tremendous growth from 2007 through 2009, and was contributing a tremendous amount of revenue. When that growth slowed, inevitably the industry as a whole was sure to feel the effect.
Unfortunately for Nintendo, its biggest market – the United States – is the one that has been most problematic in the past year. Looking at the company's latest financial results provides an enlightening window into the company's global revenue picture.
For example, if we look at the trailing 12-month revenue for Nintendo globally, measured at the end of September in 2010 and then again 2011, the results look like the following.
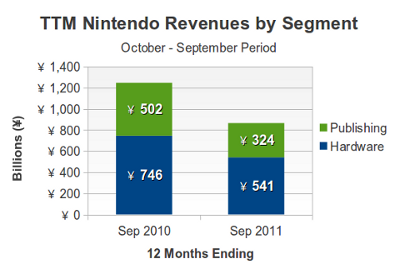
Nintendo has two major segments in its business: hardware and publishing. In the past year, revenue from publishing has fallen by approximately 35 percent while revenue from hardware has fallen 27 percent, relative to the previous comparable 12-month period.
During the period ending in September 2011, shown above on the right, the company launched its Nintendo 3DS handheld at a prices that consumers were unwilling to accept. As a result, the company cut the price by about 40 percent and as a result its hardware revenues – and margins – were trimmed significantly.
At present, consumers are buying the new handheld at a rapid clip, and the price cut has been effective. However, software for the 3DS has yet to stem much of the decline in software sales for the Nintendo DS and Nintendo Wii.
Whereas Nintendo has preserved its profit margins for years by selling hardware at a healthy profit, then added more profit on software sales, that strategy has been upended by the failure of the 3DS at its original premium price.
As we noted earlier, Nintendo's declines differ regionally.
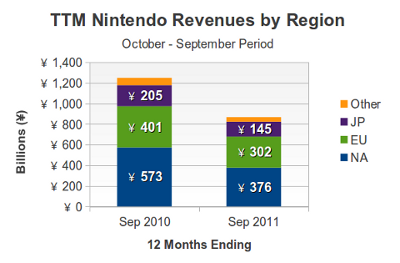
As the graph above shows, North America not only generates the most revenue for Nintendo, but it also has experienced the greatest decline in revenue. During the last 12 months, hardware and publishing revenue in North America fell to ¥376 billion from ¥573 billion in the previous comparable 12-month period. That's a decline of over 34 percent, compared to declines of 25 percent in Europe and 29 percent in Japan.
A vivid demonstration of the difference between Nintendo's position in the U.S. and its position in Europe was made by Satoru Iwata, president of Nintendo in his briefing to investors in late October.
In describing Nintendo's position in the U.S., Iwata showed the following all-format top 20 chart created from the NPD Group's data from January through September 2011. The Wii titles are highlighted in cyan and the Nintendo DS titles are in magenta.
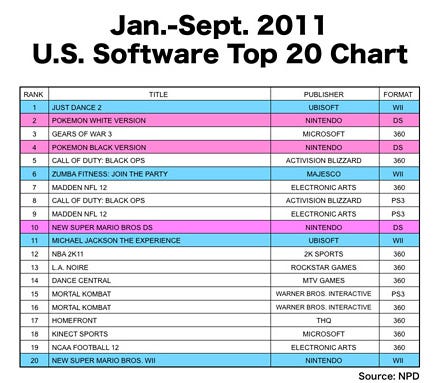
While Nintendo does dominate the top 10, with five titles on its two platforms, ten of the top 20 games are for the Xbox 360. Only seven out of the 20 are on Nintendo's platforms, and only the two Nintendo DS Pokémon titles are new in 2011. All the Wii titles are from late 2010 or earlier.
By contrast, eight of the other slots on the chart are new 2011 titles for the Xbox 360 or the PlayStation 3.
Now compare the chart above to the top 20 titles from a collection of 14 European countries, again taken from Iwata's presentation:
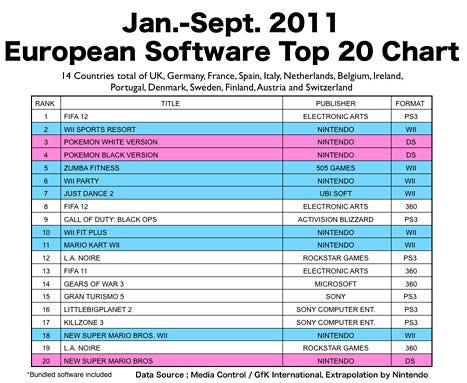
The difference is clear, as the Wii dominates with seven titles in the top 20. Include the three Nintendo DS titles and Nintendo owns half of the top 20 in Europe for this year. More importantly, the Wii itself has five titles in the top 10 – so even if there is a significant decline in unit sales toward the end of the list, it's clear that Nintendo titles are still selling well.
Regardless, its performance in Europe is cold comfort. The company isn't really growing its sales there, just seeing a slower contraction than in the U.S.
And that really is the difficulty for Nintendo overall: it barely has any prospects of maintaining reasonable sales levels, much less fostering growth, compared to what it was capable of just a year ago. If we take the face meaning of Nintendo's public comments, that it will release more details about the Wii U at E3 2012, the company's next console appears to be headed for a launch sometime in the second half of next year.
Without a home run from the Nintendo 3DS – and that's far from guaranteed – Nintendo's business through this time next year looks very grim indeed.
As part of our regular reports on sales in the United States, as provided by the NPD Group, we hope to begin integrating more data from other sources. One primary source for information is from the public companies that produce games.
For our initial foray into this area, we have included several third-party publishers: Activision Blizzard, Electronic Arts, Take Two, THQ, and Ubisoft. In the future we will include several other publishers, such as Capcom, Konami, Majesco, Namco Bandai, Sega Sammy, and Square Enix.
We have data for Nintendo, but are not including it in this overview of third-party publishers. The two other first-party publishers – Microsoft and Sony – may be included in some limited way, where possible.
We will focus on several major questions, addressed through the revenue data for our given five publishers. First, how fast is the digital part of the market growing, and how big is it relative to the retail market? Next, where are these publishers generating the most revenue, and which platforms are seeing the most growth? Finally, as this column is primarily U.S.-centric, we will get an idea of how big the North American market is compared to the rest of the world and, again, look for the changes in the past year.
As we discussed in last month's column, the effect of non-traditional content sales is still unclear. Not only are the revenue streams difficult to measure, but the NPD Group's current Games Industry: Total Consumer Spend is focused on the United States and, though it is clearly getting better, we still harbor some concerns about the margin of error in its current figures.
In the public documents provided by three publishers – Activision Blizzard, Electronic Arts, and Ubisoft – we believe we were able to get reasonably clear statements of digital revenue compared to traditional retail revenue.
(Below, as with all the subsequent graphs, we are comparing two periods: October 2009 through September 2010 (on the left, except in the pie graphs) and October 2010 through September 2011.)
Here is the picture of digital versus retail that we have pieced together:
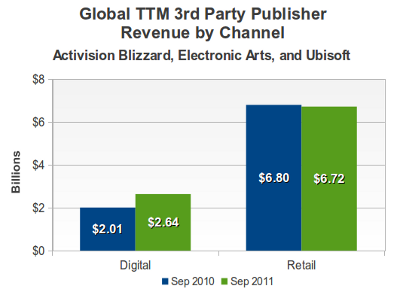
We believe that there are two important takeaways from these figures. First, the combined growth rate in digital over the past 12 months has been around 31 percent. While a figure of 30 percent has been tossed around elsewhere, we believe the data above is about as concrete a measure of that segment's growth as we have seen, especially across multiple publishers.
Second, the decline in retail sales is actually quite modest – almost precisely 1 percent – compared to what one might have expected. How do we square this with the much-reported decline in retail sales? Here, we believe it is partially a side-effect of the choice of publishers. Both Activision Blizzard and Electronic Arts have taken pains to insulate themselves from the decline of the Wii and Nintendo DS over the past year. Their investment in the HD consoles, where the market is still growing, has limited their exposure to some of the weakness at retail.
In a year, we hope that Take Two will have continued to report its digital revenue figures as it has over the past several quarters. If we were to include its digital figures in the October 2010 – September 2011 data above, we could add an estimated $110 million to that total. It would be helpful for the industry as a whole, in fact, if more publishers released clear data about their retail and digital sales segments.
Before moving on to other issues, we wish to note two more points. First, at least by this measure, the current market's split is approximately $2 from retail for every $1 through digital distribution. There is still a long way to go before digital eclipses retail, but the industry certainly appears to be a lot closer than it was just a year ago. Finally, we should keep in mind that profit margins on digital sales are probably much higher generally than are retail sales. So while the digital segment is smaller, it may actually be contributing significantly to a company's profits.
Next we ask, of the current three consoles, which are generating the most revenue among our larger group of five publishers? The graph below shows the latest 12-month data available, compared with a year earlier.
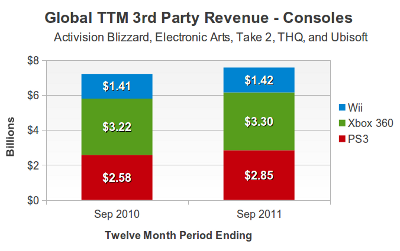
Here we see an already familiar story. The big publishers are generating tremendous revenues on the HD consoles while the Wii looks more like a side business. Even so, the Wii business by this measure has only declined by less than 1 percent in the past 12 months, which isn't as bad as one might have expected given the situation the United States.
The Xbox 360 eked out a modest 2.5 percent increase during this period, while revenues for the PlayStation 3 increased a more pronounced 10 percent.
It will be very informative to see where the situation stands in two years, after Nintendo's Wii U has had an opportunity to establish itself. Current indications are that it shares much of the same power as the existing HD platforms, and should therefore be a natural third target for publishers creating content for them. However, Nintendo will likely still have to evangelize its platform to third-parties and create the right incentives to get first-class treatement.
On the handheld side, the picture is not pretty for anyone.
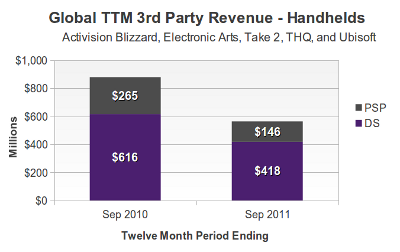
The decline in PSP software revenue is expected: these publishers have largely abandoned that platform. As for the Nintendo DS, we believe the larger factor at work here is the insurgent mobile platforms, like the iPad, iPhone, and other smart devices. We believe it unlikely that the Nintendo 3DS will break this cycle any time soon.
For our final slice of the data, we have looked at how the revenue of these publishers varies regionally. Because we have no Japanese publishers represented, we believe that that Japan specifically and Asian countries generally are under-represented in these tallies.
The data we have is presented below for October 2009 – September 2010:
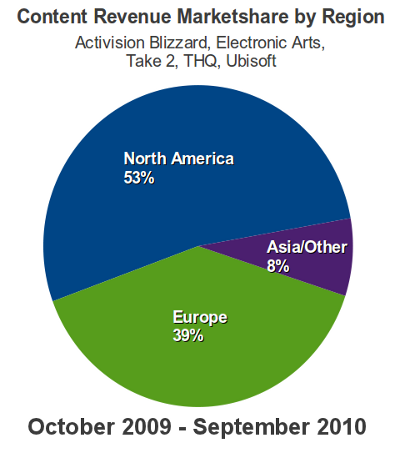
And then the same measure, but for October 2010 – September 2011:
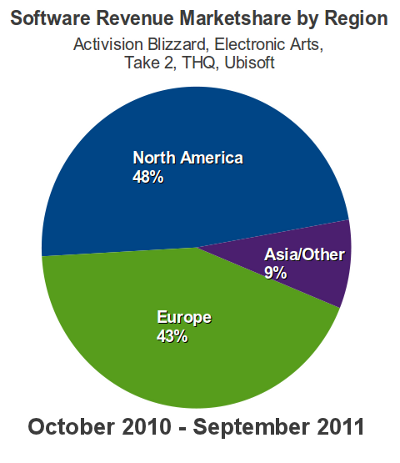
The story here is that Europe's share of the global video game content market appears to be growing – as is its actual revenue – while revenue in North American is contracting. Outside of North America and Europe, which largely includes what the publishers generally refer to as the Asian or Asian Pacific region, revenues for these publishers grew over 10 percent.
In three months all these publishers, and the others we hope to add, will have reported results for calendar 2011 and we will revisit these measures and possibly some others.
[As always, many thanks to the NPD Group for its monthly release of the video game industry data. Thank you in particular to NPD Group analyst Anita Frazier for her monthly analysis notes, Liam Callahan for his added insights, and David Riley for personally making it all work.
Additional credit is due to Michael Pachter, analyst for Wedbush Securities, for his perspective, instrucive conversations, and entertaining anecdotes. We also drew on the comments of Doug Creutz of Cowen and Company, and wish to thank him for his perspective.
Finally, many thanks to colleagues at Gamasutra and particularly regular commenters on NeoGAF for many helpful discussions.]
Read more about:
FeaturesYou May Also Like