


Trending
Opinion: How will Project 2025 impact game developers?
The Heritage Foundation's manifesto for the possible next administration could do great harm to many, including large portions of the game development community.
Gamasutra analyst Matt Matthews examines December 2010's U.S. video game retail sales data from NPD Group, and looks to 2010 events like the launch of Kinect, contraction of retail software sales and the rise of digital models to see what 2011 may have in store.

[Gamasutra analyst Matt Matthews examines December 2010's U.S. video game retail sales data from NPD Group, and looks to 2010 events like the launch of Kinect, contraction of retail software sales and the rise of digital models to see what 2011 may have in store.]
On Thursday the NPD Group released its estimates for retail video game sales in December 2010. It also released estimates for consumer spending on all video game content, including social games, digital distribution, and used games.
Not only were retail sales of hardware and software down for the year, but even with the additional revenue from the extra-retail sources, the full market size remained constant from 2009 to 2010.
Below we will look back at 2010 and pick out the big trends and then look forward to 2011. In the new year the industry faces several big questions:
The launch of Xbox Kinect has changed the balance in the console market. What will we consider the new status quo a year hence? Where will Nintendo take the Wii as its sales pace slows?
Retail software sales have slowed significantly. Where is the contraction and where is the growth? What are the factors driving the decline?
The NPD Group estimates that total consumer spending on games in 2010 was essentially flat from 2009 – even when extra-retail sources like digital distribution and social games are considered. What do these new figures tell us?
Read on for complete details.
After a good run in October and November, during which the industry posted gains in software and in accessories, the final totals for the industry were below expectations in December.
Few new games were launched in December, but some notable titles like Disney's Epic Mickey for the Wii and Activision Blizzard's World of Warcraft: Cataclysm for the PC, did well.
Moreover, Activision Blizzard's Call of Duty: Black Ops and Ubisoft's Assassin's Creed: Brotherhood and Just Dance 2 all continued to have strong sales in their second month. Despite this, software sales were down for the month both in units and in revenue.
Only the accessory segment – where both Microsoft's Kinect and Sony's Move peripherals are counted – showed growth in December and for the full year. As expected, there was also significant growth in points and money cards for services like Xbox Live and the PlayStation Network.
According to NPD Group analyst Anita Frazier, these cards “grew the most in unit volume” of any accessory, relative to sales in 2009. She went on to call this a “retail reflection” of the growth of extra-retail distribution channels.
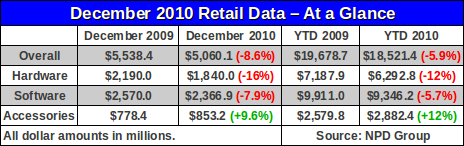
Below we have collected the December 2010 and full year figures for retail sales in 2009 and 2010.
The NPD Group also released its 2010 estimates for total consumer spending on video game content, through retail and other sources. They put the value of the market for video game content at $15.6-15.4 billion; this represents $5.5-5.3 billion of additional revenue on top of the $9.35 billion in software sales shown in the table above.
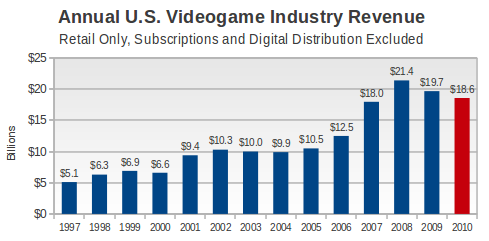
Last month we described how the industry might have reached $19 billion by moving $1 billion in accessories and showing growth in the software segment. Neither of those events came to pass, so the industry ended the year at $18.5 billion. The figure below puts the December and full-year results in context with the past few years.
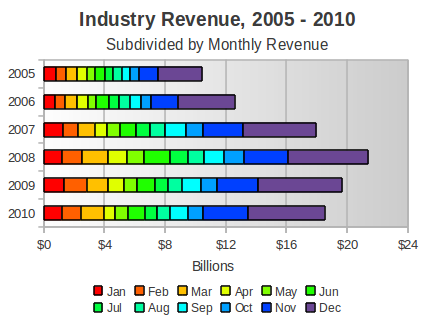
To put the last couple of years into context, we have gathered the retail sales data from 1997 to the present in the figure below. While the scale is different, we do note that total sales contracted from 2002 to 2004 in a gross manner not unlike the contraction of 2008 to 2010.
Should the retail video game market contract any further in 2011, then it will probably be the longest such contraction in the last 20 years of the video game market. Moreover, the industry will have reset to a level lower than the beginning of the huge growth experienced between 2006 and 2007.
The biggest hardware story of the year is clearly Microsoft's execution of its two-stage relaunch of the Xbox 360 platform.
In June 2010, the platform saw a tremendous gain of momentum with the launch of the Xbox 360 S Model. More than just a hardware revision, the restyled console saw its sales jump 63% in the June – October period compared to the same period in 2009.
Amidst the resurgence in hardware sales, Microsoft also launched Halo: Reach, the latest entry in its flagship shooter series. Hardware surged to over 480,000 units for the month while 3.3 million copies of Reach were sold to consumers.
Then Kinect – a camera and software combination that permits users to control software with body motions – launched in November 2010 and hardware sales accelerated further. While December sales were up a less spectacular 42%, Larry “Major Nelson” Hryb of Microsoft claimed that the company had run out of consoles by the end of the month, suggesting that supply was at least somewhat constrained.
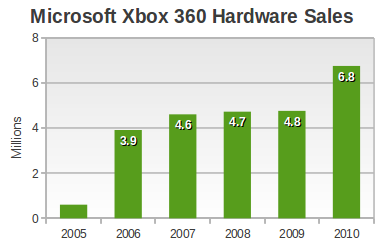
Absent those shortages, we would have called Microsoft's 2010 performance flawless. As it stands, they still pushed their console to a very strong finish, with annual hardware sales of 6.8 million systems, up 42% from 2009.
(We will discuss software sales in more detail later, but for the moment let us note that Xbox 360 software was up 17% in units and 14% in dollars over its 2009 levels.)
Microsoft's Xbox 360 nearly outsold the Wii in 2010, falling short by only 305,000 units. That the two consoles ended the year so close has as much to do with the 2.5 million system (or 26%) decline in Wii sales as it has to do with the 2.0 million increase in Xbox 360 sales.
All signs point to continued momentum for Microsoft's console business in 2011, which suggests that it will increase its hardware sales in 2011. This is particularly likely if it finally gives its consoles a proper price cut, something that hasn't happened since September 2008. Should the entry-level Xbox 360 have an MSRP of $150 before Christmas, we would expect it to see hardware sales levels similar to 2010.
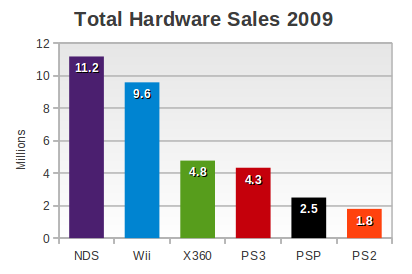
To put the Xbox 360 sales into context, let us consider the following figure which shows annual hardware sales from 2009 (i.e. not the year that just completed).
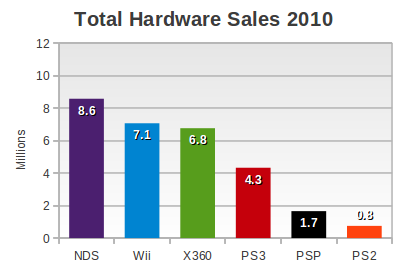
Now we present the same figure, but for 2010.
In the next section we will consider how the Nintendo Wii and PlayStation 3 each fit into the hardware picture from 2010, and where they might be headed in 2011.
As the two previous diagrams showed, only the Xbox 360 showed growth in 2010. The PlayStation 3 held its ground at 4.3 million systems. Nintendo's two systems, the Wii and Nintendo DS, were each off by over 2 million units from 2009, and Sony's ailing PSP and aging PS2 both fell into further irrelevance.
The Wii is in the equivocal position of being the first-place console 2010, but also experiencing a precipitous year-over-year decline from 2009.
So, for example, the Wii is simultaneously selling better than the PS2 did in its fourth calendar year on the market (7.1 million vs. 4.7 million) but also experiencing a sharp 26% decrease from the previous year that is at least suggestive of a much weaker year in 2011.
This happened in spite of Nintendo making a strong effort to build on its library of classic properties. Just in 2010, Nintendo released new Wii titles in its Metroid, Kirby, and Donkey Kong series and also promoted a special Super Mario Bros. All-Stars package.
Moreover, its evergreen titles like New Super Mario Bros. Wii and Wii Fit Plus continued to sell well enough to rank in the all-format top 10 for the year.
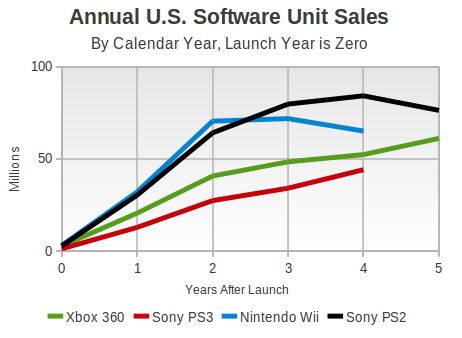
Let us continue the analogy with the PS2 and note that the figure below demonstrates that PS2 and Wii sales peaked in their second calendar years on the market (i.e. in 2002 and 2008, respectively), and then declined in both the third and fourth years.
In fact, both the Wii and the PS2 had their annual sales decline by the same rate (26%) between their third and fourth full years on the market.
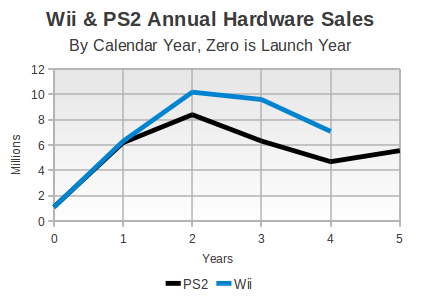
Yet, as you can see above, the PS2 rebounded to 5.5 million systems in its fifth year. Whether we can expect the same of the Wii in 2011 is unclear. If one takes the position that software drives hardware (and it does, in some instances) then 2011 does not appear to be the same kind of year that 2005 was for the PS2.
Remember that many classic PS2 titles were released in 2005, including Devil May Cry 3, God of War, Gran Turismo 4, Resident Evil 4, and many others. Just in terms of raw sales, the PS2 dominated sports games that same year with Madden NFL 06 moving nearly 3 million units, NCAA Football 06 over a million, MVP Baseball 2005 just under a million, and NBA Live 06 just over 800,000.
The all-format top 10 chart for 2005 also included the PS2 versions of Star Wars: Battlefront II (over a million units) and Star Wars Episode III: Revenge of the Sith (just over 900,000 units).
This is a key distinction between the PS2 and the Wii. The PS2 saw its annual software sales curve peak two years after its peak hardware sales, appearing to show that consumers continued to purchase software long after they obtained a system. By comparison, Wii software has roughly tracked with its hardware sales, and that suggests that new system owners are the primary engine of Wii software sales.
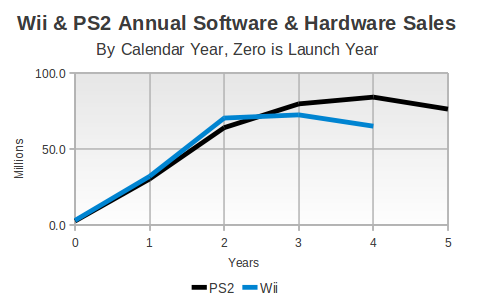
The figure below shows annual software sales for the PS2 and Wii on the same time scale as the hardware graph just above.
Note how Wii hardware and software peaked together in 2008 and 2009 (years 2 and 3 on the graph) and then fell together the following year. However, PS2 software grew in 2003 and 2004 (again, years 2 and 3 on the graph) while the system's hardware sales fell.
Even with Nintendo's strong backbone of evergreen titles (New Super Mario Bros. Wii, Mario Kart, Wii Fit, and others), it seems unlikely to us that the Wii will avoid another down year in hardware based on its software slate alone.
Should Nintendo and third parties choose to announce new titles in the coming months, then of course this position could shift. Remember that Donkey Kong Country Returns wasn't announced until June 2010 and has sold over 1.8 million units since its November launch.
A price cut would certainly help the Wii. When the PS2 rebounded in 2005, it had already been cut to $150 in early 2004. The Wii has reached that effective price with retailer bundling (e.g. a Wii and $50 gift card for $200), but since the system officially dropped to $200 in September 2009, it hasn't seen a true cut in price.
In fact, Michael Pachter, analyst for Wedbush Securities, commented in a recent correspondence that “Nintendo should cut hardware prices first” while it will likely be Sony who ultimately makes the first move. He believes that Nintendo is ceding marketshare to its competitors (probably mostly to the Xbox 360 and Kinect, if we had to speculate) and could reverse that trend with a lower-priced Wii.
Which leads us to conclude that it seems likely that the Xbox 360 will outsell the Wii in 2011. That would be an astonishing reversal of fortune, especially given the rapidity of the Wii's rise through 2009. Should the Wii rebound, even slightly, during 2011 then we expect it to retain its annual dominance over Microsoft's console.
According to the NPD Group estimates for all of 2010, the retail software market shrank again for the second year in a row. In 2008, consumers spent $11 billion at retail on console and handheld software. The following year that spending fell 10%, to $9.9 billion, and then in 2010 it fell by a further 5%, to $9.4 billion.
There are many possible explanations. According to Wedbush analyst Michael Pachter, the music game genre declined to below $300 million for all of 2010, after reaching approximately $900 million in 2009 and nearly $1.7 billion in 2008.
Wii Fit was also another big-ticket item classified as software during that same period, and its sales have declined and dropped in value as consumers who already own Wii Balance Boards opt to upgrade to the software-only version of Wii Fit Plus.
At the same time, the traditional handheld software market has been under assault from many pressures, including competition from devices like the iPhone and iPod Touch which offer cheap or free games through Apple's App Store.
In each of 2007 and 2008 the Nintendo DS and PSP software market was worth around $2 billion annually. According to Doug Creutz of Cowen and Company, that market's retail value dropped by 10% in 2009, and then dropped another 24% in the past year.
While it is tempting to ascribe much of that decline to the implosion of the PSP market, we still note that the Nintendo DS generated 20% less revenue in 2010 than it did in 2009, even as its installed base increased in size by more than 20%.
Even the decline of the PlayStation 2 has played a part: we estimate that PS2 software revenue dropped by 50% from 2008 to 2010, a loss of about $200-$250 million.
And then there is the ongoing recession in the United States which started in December 2007, according to the National Bureau of Economic Research. It stands to reason that consumers suffering through unemployment or foreclosure are far less likely to spend money on leisure items like video games.
How bad is the current decline? It's enough that the term “persistent secular decline” seems more appropriate each month. (The term was notably used by Wedbush's Pachter to describe investor perception of video game market contraction.)
While analysts have speculated that software could rebound in 2011 (e.g. “low double digit” growth according to Pachter, +3% according to Cowen and Company's Creutz), that growth is still relative to the weak results posted in 2010.
Even at 12% growth, the retail software figure for 2011 would still fall short of the $11 billion mark set in 2008.
Here is the current decline in an easy to visualize form. The first figure shows how total software revenue has changed since 2007.
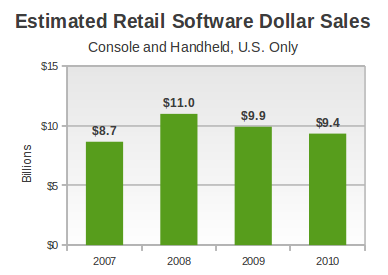
While the installed base of current generation has expanded from about 20 million consoles and 28 million handhelds at the beginning of 2008 to 75 million consoles and 65 million handhelds at the end of 2010, the total revenue being generated by those platforms has declined by about $1.6 billion.
During that same period, we can look at software unit sales and see a similar decline.
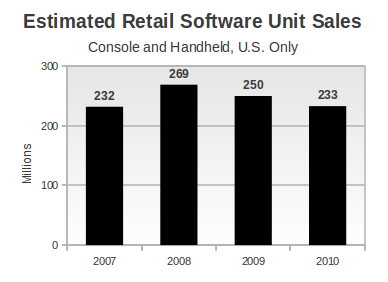
The striking point about this view of software sales is that the volume of software sold at retail has essentially returned to the level seen in 2007 – the first full year that the PS3 and Wii were on sale.
We should note that it isn't that the current generation hardware systems aren't increasing their software sales. In fact, they are, as the figure below shows.
According to Pachter, the current generation consoles – Xbox 360, Wii, and PS3 – collectively increased their software unit sales by nearly 8%. While the Wii did decline (from over 70 million to 65 million units), the growth in the PS3 and Xbox 360 markets more than compensated for that decline. Software revenue also increased on those platforms in 2010, albeit by a much more modest 3%.
Stepping back a bit, this means that growth in the current generation console market has not made up for greater declines elsewhere – in handhelds and the old PS2 market.
Those consumers haven't disappeared, and we consider it unlikely that people have en masse turned away from video games. Rather believe that consumers are finding their gaming in other areas. The NPD Group has attempted to measure the money spent by consumers in these other areas, as part of their Games Industry: Total Consumer Spend (2010) report, the full version of which is due out in March 2011.
The figures that the NPD Group has released so far regarding 2010 provide at least one measure of where the money is going. Here is what they have said:
Consumers spent $6.3-6.6 billion in the first half of 2010 on new physical games, used games, game rentals, subscriptions, digital full-game downloads, social network games, downloadable content, and mobile game apps.
Consumers spent approximately $15.4-15.6 billion in all 2010 on those same types of content.
That annual figure reflects a flat to 1% decline over the same measure for 2009.
Taking into account the known physical retail game sales figures (again from the NPD Group), we arrive at a few conclusions.
First, consumers spent approximately $5.3-5.5 billion on content outside of new physical games in all of 2010. That represents 33%-36% of the full video game content market.
Second, we can estimate that consumers spent between $4.9-5.1 billion outside of new physical games in all of 2009, or roughly 31-33% of the full video game content market.
Those figures show that the extra-retail market is growing, but modestly. The annual rate is around 4-12%. If the extra-retail market continues to grow at a rate in this range through 2011, we can expect that that segment of the market will reach $5.5-6.2 billion.
However, there are also some parts of the NPD Group's data that make us skeptical. Specifically, if the total extra-retail market was worth $2.6-2.9 billion during the first half and only $5.3-5.5 billion for the full year, then these other areas of consumer spending don't appear to be nearly as affected by seasonality as the new physical game market is.
While it is possible that the extra-retail market that the NPD Group is attempting to measure is dominated by some forces that are not seasonal (e.g. social network games need not generate more revenue at Christmas than during the spring season), the data provided so far does not suggest as much.
For the sake of comparison, the new physical game market is heavily seasonal. According to 2010 figures, new physical software sales generated $3.5 billion during the first half of the year and $5.9 billion during the second half, an increase of nearly 70%.
There is one other point worth noting. When the NPD Group released its first estimates of extra-retail spending for 2009, it specifically left out social network games and cited a total market value of $15.0-15.25 billion. Given the differential between this result and its revised result, one arrives at the suggestion that social network games were worth about $250-350 million in 2009.
It is possible that these estimates provided by the NPD Group are the very best currently available. However, the value of social games and the non-seasonality of the revenue streams give us pause.
Therefore, we again renew our call for more transparency from publishers and platform holders, either independently or in conjunction with a third party like the NPD Group. They alone can provide substantial data on unit sales and revenue in areas like Xbox Live, the PlayStation Network, Steam, and even Facebook.
[As always, many thanks to the NPD Group for its monthly release of the video game industry data, with a special thanks to David Riley for his assistance and Anita Frazier for her helpful analysis. Additional credit is due to Michael Pachter, analyst for Wedbush Securities, for his perspective and instrucive conversations.
We also wish to thank Doug Creutz of Cowen and Company for his insights. Finally, many thanks to colleagues at Gamasutra and particularly regular commenters on NeoGAF for many helpful discussions.]
Read more about:
FeaturesYou May Also Like