Daily news, dev blogs, and stories from Game Developer straight to your inbox
Sponsored By
Featured Blog | This community-written post highlights the best of what the game industry has to offer. Read more like it on the Game Developer Blogs.
GameDiscoverCo's Simon Carless shares some data on why your game's first week of sales and first year of sales might correlate--at least on Steam.
6 Min Read

[The GameDiscoverCo game discovery newsletter is written by ‘how people find your game’ expert & GameDiscoverCo founder Simon Carless, and is a regular look at how people discover and buy video games in the 2020s.]
GameDiscoverCo asked nicely for your anonymized Steam data. And we got it - more than 75 responses, all for games that launched in 2019, 2020, or 2021. We got data from games that grossed hundreds of dollars in their first week on Steam, and titles that grossed millions of dollars in that same time. (Thanks to everyone who submitted!)
We didn’t have one central purpose with this survey. Instead, we wanted to grab a few disparate pieces of data, and see what interesting trends we could identify. A reminder: we didn’t do ‘Steam reviews to sales ratio’ because it’s quite well settled by our work last year, and VGInsights’ recent expansion of that.
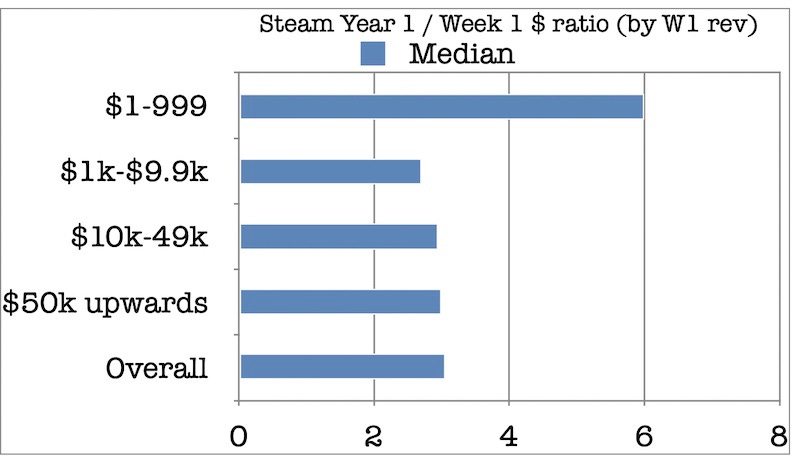
But we did want to look at how your first week Steam revenue compares to the first month, year, and beyond. We’ve done this once before - last November - and felt like we didn’t get enough recent games. And here’s the headline graph this time out, for ‘recent Steam games’:
[NOTE: the reason we use revenue, not units sold for all these ‘long tail’ calculations is that everyone discounts at different frequencies or percentages, and has different regional sales splits. So this equalizes everything to correspond to ‘real money’.]
We’re seeing that anyone who grossed at least $1,000 in Week 1 on Steam for releases during 2019 and 2020 getting a median of between 2.75x and 3x that amount of money, by the end of their first year on sale on Steam. In fact, the median of all categories is Year 1 revenue being 3.05x Week 1 revenue.
You’ll see one outlier up there. Because you might have sold a handful of copies if you just grossed a few hundred dollars, it’s possible to sell 100 or 200 more units in the rest of the year and get a very high revenue multiple. This explains the Year 1 median of 6x Week 1 - for games that sold $1-$999 in their first week on Steam.
But we’re largely going to disregard these in our data-set. It’s not what most of you will see. And the combined ratio without Week 1 revenue of $1-$999 is pretty much exactly Year 1 = 3x Week 1. Here are the individual data points that make that up:
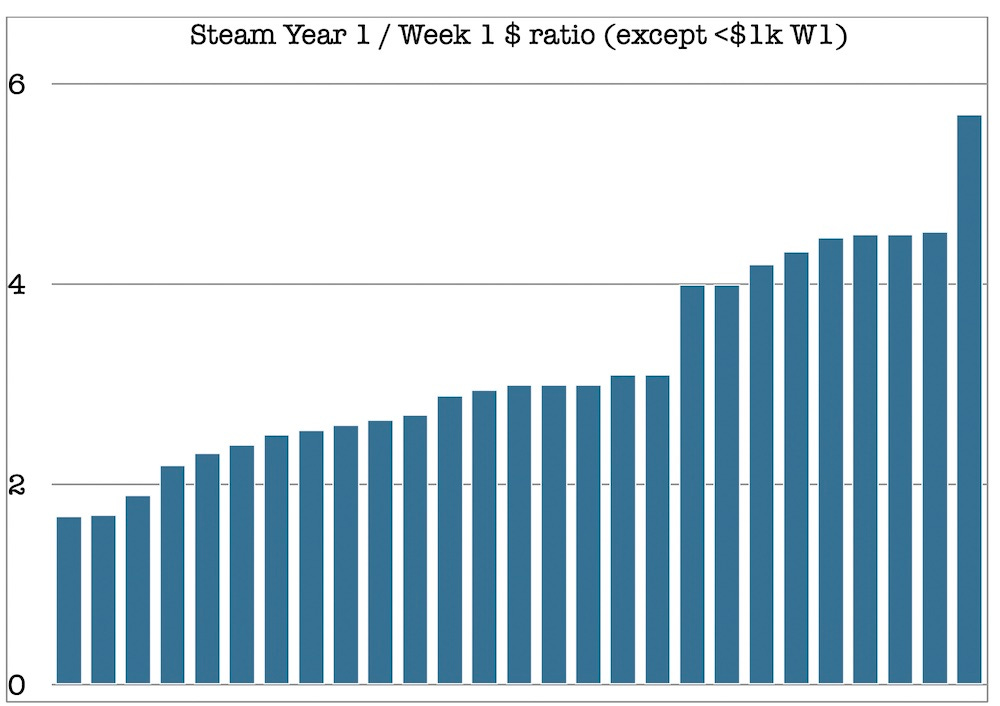
Interesting, huh? Most games - save a very few outliers - are ranging from Year 1 = 2x Week 1 revenue to about Year 1 = 4.5x Week 1 revenue. So that gives you a great idea of average range of outcomes. But what else separates these games? Well:
We looked solely at the titles that were >4x Year 1 revenue compared to Week 1, and they weren’t distributed only in a certain ‘first-week revenue’ set. They were all over the place, in fact - no clear pattern. (Though the above headline graph suggests sliightly better multiples with higher first week revenue.)
Over the whole data set, we really don’t see any indication that these Week 1/Year 1 multiples are majorly varying from release year to release year. It’s possible that when we saw some shifts before in finding a 4x median, it was survivorship bias from older successful games. But we see no big shifts from 2019 to 2020, and this is the state of ‘now’ on Steam.
Are the ratios different for Early Access games? Not really. Excluding the $1-$999 first week titles, the median for Early Access games (most of which hadn’t done a 1.0 launch during the year) was 3, and the median for regular releases was 2.85. The slightly depressed visibility for EA launches could account for that, in part - and more added features from an EA title, etc.
Finally, we did look quickly to see if a game’s default price could affect its Week 1/Year 1 ratios. And the answer is - maybe, a tiny bit. Games that cost $30 or more games had a median Year 1 multiplier of 3, $20-$29 games had a median of 2.95, $15-$19 games had a median of 2.825, and $10-$14 games had a median of 2.575. Not saying ‘charge more for your game because it’ll get a better multiplier’, though, haha.
(And finally, games costing between $1 and $9 had a Year 1 multiplier of 5. But these are mainly the hobbyist games grossing less than $1,000 in a week. And we talked about the distorting effect of these already.)
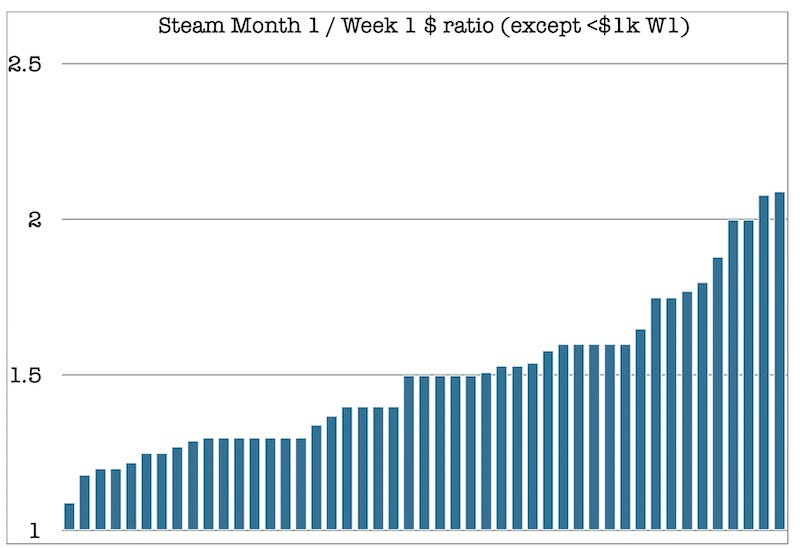
We also wanted to present some bonus data. Here’s the full set of data (except games that grossed <$1,000 in Week 1) for the multiple of Week 1 revenue that Month 1 is:
So if you’re explaining this entire section of the survey, and trying to give an idea of range of possible outcomes in addition to the median (vital!), we have:
Month 1 / Week 1 $: Median = 1.5x, range (excluding outliers) from 1.2x to 1.9x
Year 1 / Week 1 $: Median = 3x, range (excluding outliers) from 2x to 4.5x
Year 2 / Week 1 $: Median = 4.2x, range (excluding outliers) from 2.8x to 7.5x
Just summing this up in practical terms? Whew, we’re feeling good about putting Year 1 Steam revenues as 3x Week 1 in the Steam revenue estimate document we put out recently, given that was a bit lower than the data we had at the time.
And in general, we already knew that this area of Steam had a fairly tight set of possible outcomes. It’s things like ‘wishlists to sales ratios’ that are far more of an unpredictable wildcard. That’s what we’ll get into in the next Steam survey results newsletter - coming to all readers in the near future!
[We’re GameDiscoverCo, a new agency based around one simple issue: how do players find, buy and enjoy your premium PC or console game? You can subscribe to GameDiscoverCo Plus to get access to exclusive newsletters, eBook and a Discord, plus interactive daily rankings of every unreleased Steam game, and more besides.]
Read more about:
Featured BlogsAbout the Author(s)
You May Also Like